


Table of content:
- Intro: How much data lies in 50 million Tweets?
- 2019 L&D Twittersphere in numbers
- Follow for a follow
- The Big 7 retain the stronghold over the conversation
- L&D Global Sentiment Survey VS JollyDeck Sentiment Research
- Location, Location, Location
- Influencers influence
- Followers’ interest alignment to influencer
- Conclusion
- Final thoughts
Intro: How much data lies in 50 million Tweets?
Understanding the sentiment report
Since 2016, JollyDeck has been analysing the highest-trending topics in the L&D Twittersphere. By pulling together the top profiles in L&D and their followers, we run a yearly in-depth analysis on all of their tweets.
This allows us to look for the hottest topics in the L&D community in any given year. To do this, we match individual tweets to specific keywords and phrases that belong to a family of 23 different topics. Thirsty work, right?
Due to the nature of the medium, the tweets analysed need to have context around them. Tweets can often be gossip or shameless self-promotion. That’s why this year, we’ve looked even deeper at the relevance to let you know who has cemented the top influencer spots per topic.
2019 L&D Twittersphere in numbers
Crunching the numbers of our report
Twitter is a big place, even in the microcosm of L&D. ‘#learning’ alone has over 300 tweets per hour, so you can imagine the huge stacks of data that we were dealing with.
We wanted to make sure that our findings were as relevant as possible. To do this, we:
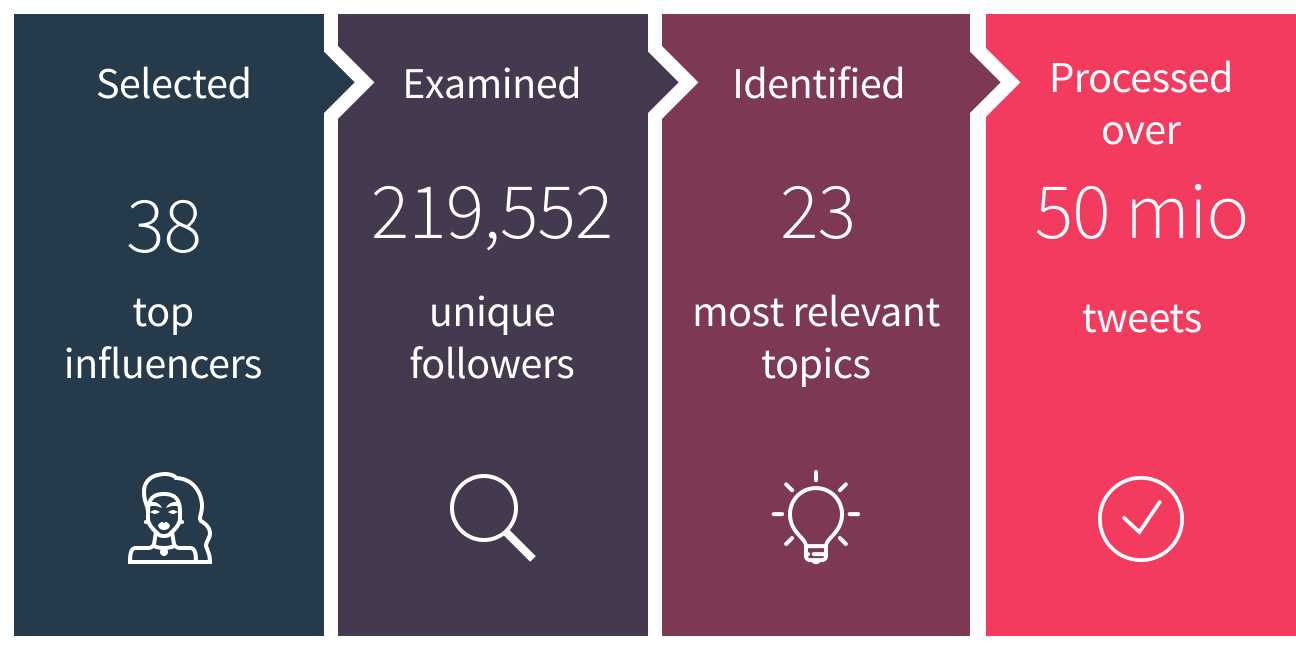
Of those 50,000,000 tweets, we found 750,000 that were relevant to our research.
Follow for a follow
How well connected is L&D on Twitter?
As a member of the L&D community, there is a strong chance you have met many of our influencers before. Be it in person or at a webinar. The L&D pool is small, but we have discovered even smaller levels of interconnectivity on Twitter.
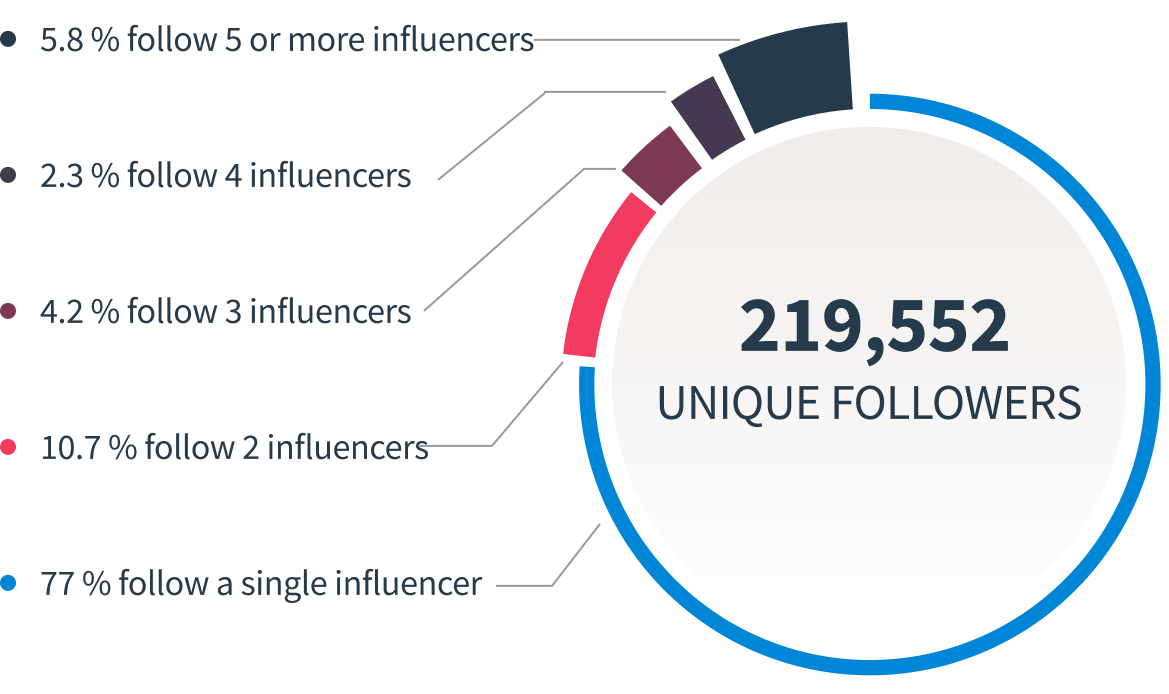
Each person on the JollyDeck editorial board follows on average 15 influencers on the list. We thought that when we looked at other accounts following one of the 38 influencers, they would typically be interested in following a few other influencers on our list as well. This, however, has not been the case.
We instead found that the 38 influencers had a combined 219,552 followers. Out of the 219,552 accounts analysed, less than 1 in 4 people follow 2 or more influencers on our list. A very small rate for such a supposedly close-knit community.
Out of 219,552 accounts analysed, less than 1 in 4 people follow 2 or more influencers on our list
Initial L&D Twitter Sentiment results
The Big 7 retain the stronghold over the conversation
An in-depth look into the hottest trends in L&D
After boiling it down to 750k of relevant tweets, which is about 1.5 % of the original 50 million, it was time to dive into the data.
As with anything in L&D, there are clear leaders that drive the agenda.
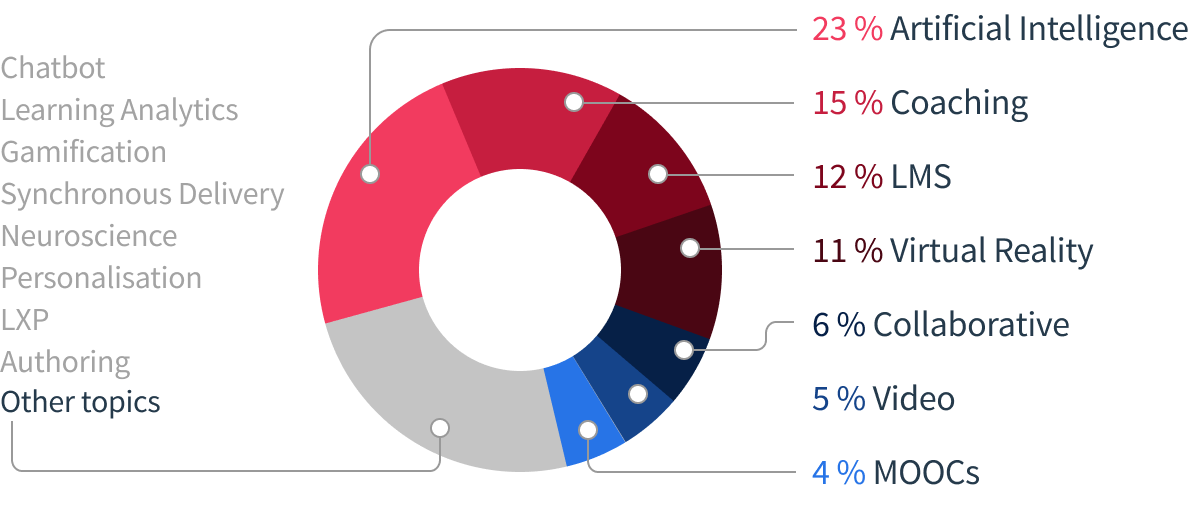
In 2019, the Big 7 topics controlled 75 % of L&D related Twitter conversations
Key surprises
- Learning Analytics are only mentioned in 3.6 % of tweets.
- Chatbots, where we look at the area of Conversational Interface more broadly than just chatbots, are in YoY decline, currently at 3.9 %.
- LXPs or Learning Experience Platforms don’t seem to be a thing of conversation with a modest 1.7 %.
L&D Global Sentiment Survey VS JollyDeck Sentiment Research
How do JollyDeck’s results stack up?
Our first analysis started with Donald H. Taylor’s ‘L&D Global Sentiment Survey’ (the GSS). Whilst both have made significant developments over the years, it’s only fair to compare the datasets.
The nod: AI is king, queen and the royal court, coming in at No. 2 in the GSS and a clear winner in this report. Trends – both self reported and measured – show that it will be around for a while.
The snub: The No. 1 topic of 2019 in the GSS’s report was Personalisation. Yet looking at L&D’s tweets during 2019, Personalisation holds a paltry 14th spot. Overall, it is mentioned in less than 1.7 % of all tweets analysed.
Personalisation came No. 1 in the GSS of 2019, while only trending 14th on L&D Twitter. Yet in 2020 it again holds the top spot in the GSS survey.
Dark horse or pie in the sky?
Learning Analytics dominated our face-to-face discussions throughout last year. Similarly, the GSS ranked it as their No. 3 in last year’s report. However, data paints a different picture yet again. Learning Analytics only comes in at a relatively modest 10th place with 3.6 % in our latest report. Despite widening our search criteria for this topic, it didn’t make a significant difference in terms of results.
This doesn’t seem to bother the L&D community much, as Learning Analytics ranked No. 1 in this year’s GSS. While we anecdotally seem to recognise that analytics holds massive potential, it’s questionable if L&D will figure out how to demonstrate it’s value.
Location, Location, Location
How do different locations affect a topic’s popularity?
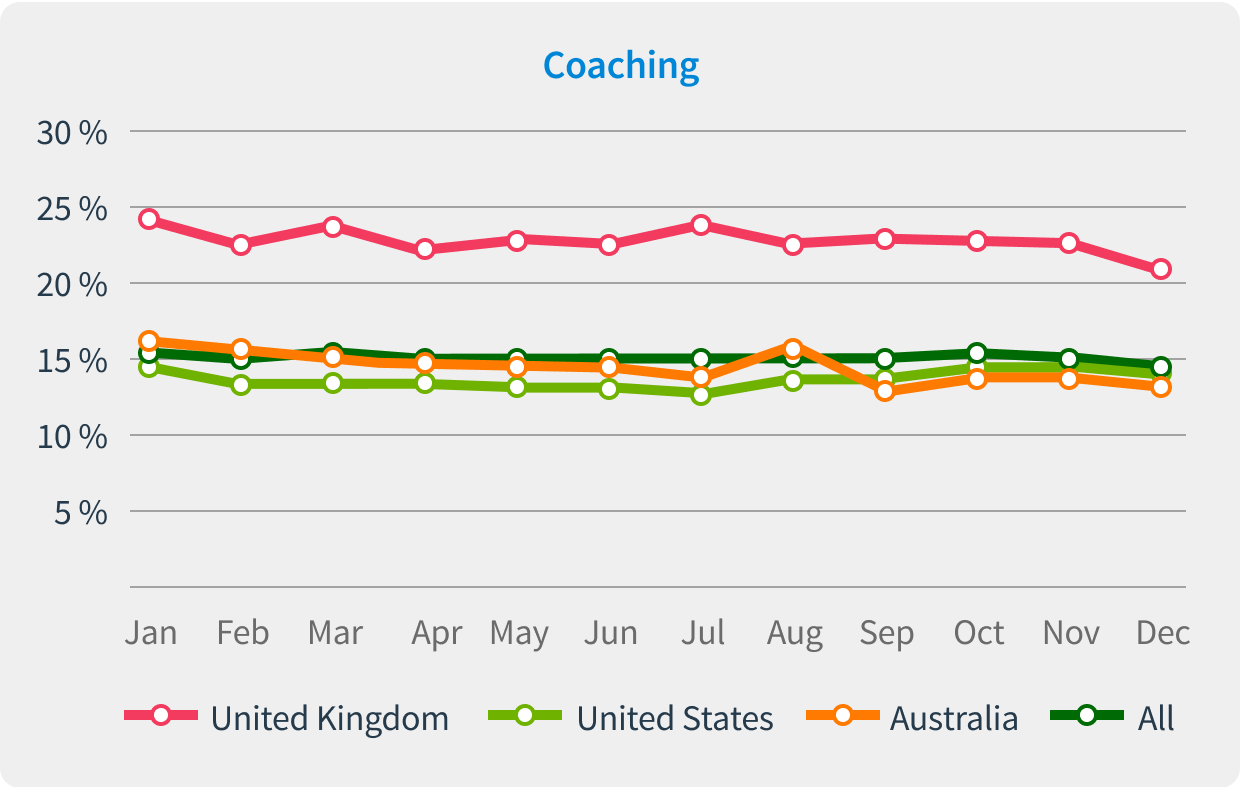
Twitter’s API allows for a basic recording of location data. Three main regions were looked at: Europe and the UK, the US and Australia. These regions were used to check for evidence in data which would back the urban myth that:
The US market is quickest to identify the trends of tomorrow.
Simply enough, all we need to do is to look at the self-reported 2019 scores in the GSS to see how they correlate to JollyDeck’s 2019 results.
Key finding 1: The idea that the US is the most forward-looking audience doesn’t hold up to the facts. We see no data to back this claim. There are no statistically confirmed trends that have originated in the US before spreading to the rest of the world. In fact, when we looked at all of our data from 2016-2019, we found no statistically significant proof of it leading the way in any field.
Key finding 2: Coaching is the only Big 7 category where one territory clearly dominates. By dominates, we mean it is 10 percentage points higher than any other other territory in absolute terms. In relative terms, Coaching was 60 % more-frequently tweeted about in the UK than in the US or Australia in 2019.
Influencers influence
The below 7 graphs correlate the impact each influencer has and how frequently they tweet about the topic. We only focused on the top performers in each topic. To qualify, influencers needed to have a net positive impact on the topic, displaying a score of 1 or higher. They also had to be interested in their topic enough to be tweeting about it throughout the year.
The position on the horizontal (x) axis represents how frequently the influencer tweeted about the topic. The vertical (y) axis refers to the impact the influencers’ tweets had.
The Impact Score is a fairly complex metric. We explored how frequently influencers tweet, and how much their tweets resonated with their followers. This means we were counting the number of likes, responses, retweets and embeds. We were then trying to determine if those came from a wide variety of accounts, or if the messages were amplified by the same group of users over and over.
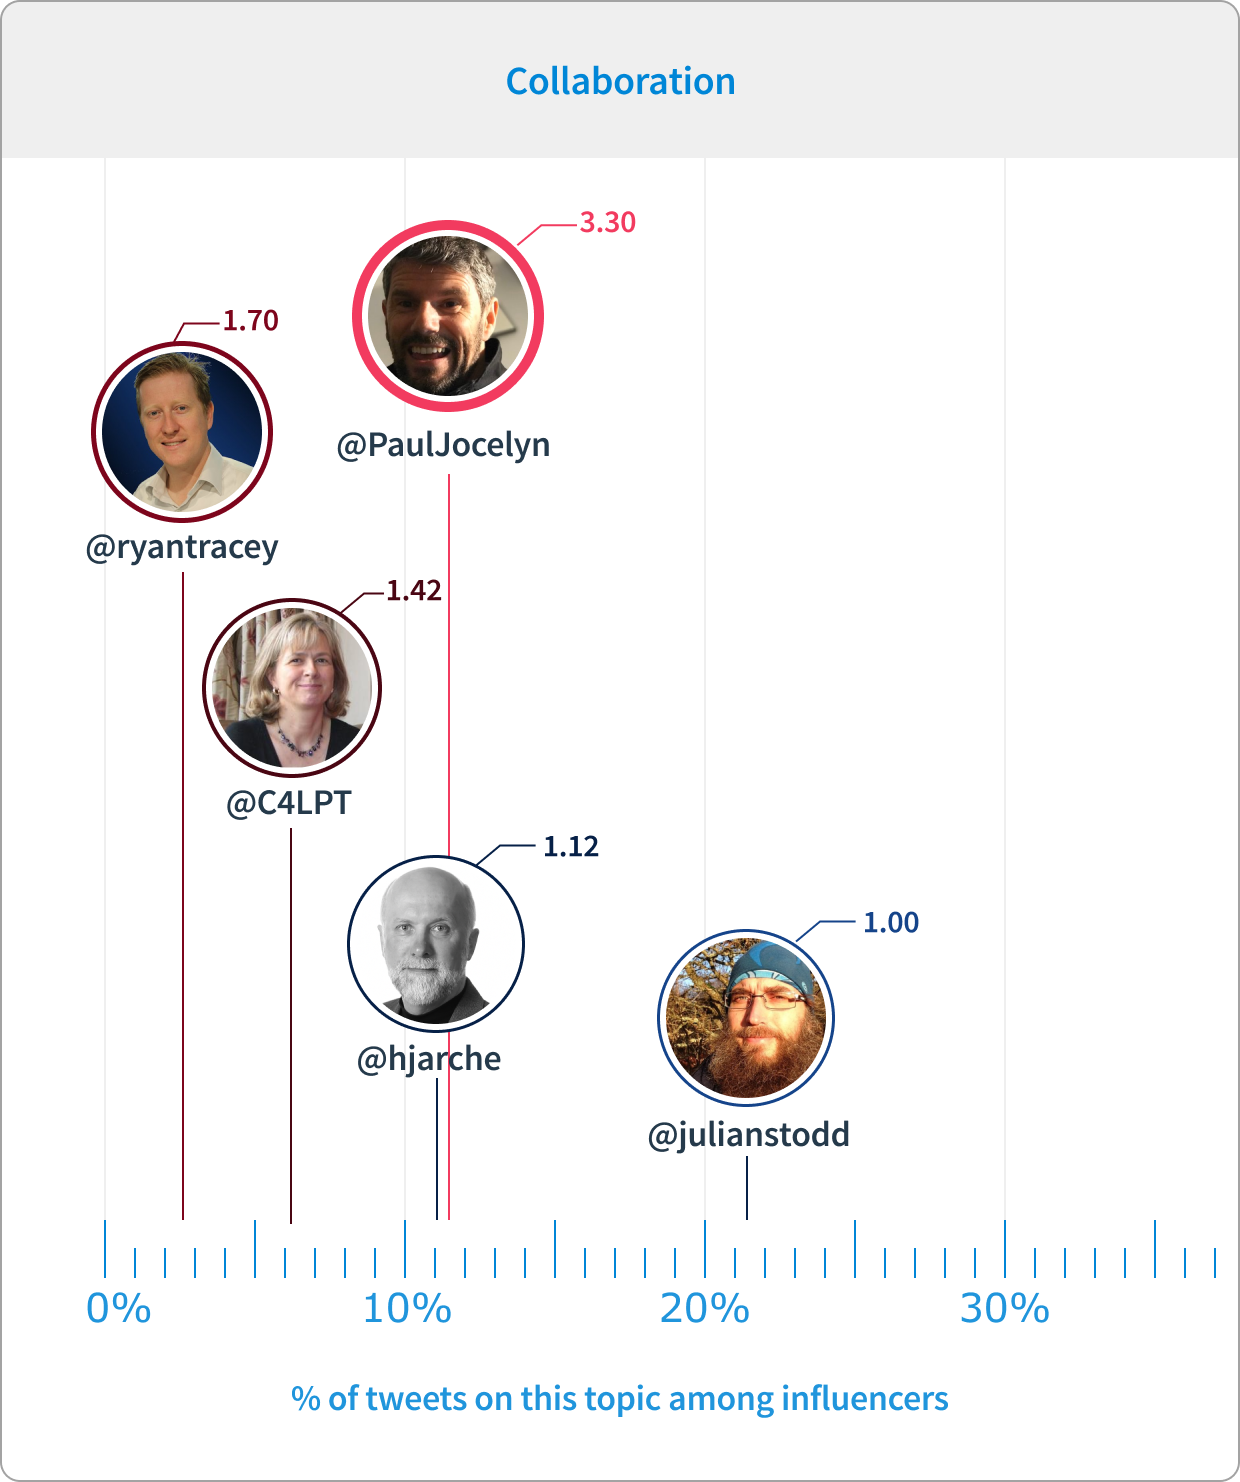
Paul Jocelyn is the clear winner with regards to their impact. It’s important to say that impact is not a linear metric. As an example, Julian Stodd tweeted about this topic the most from the Top 5 accounts. If we measure the impact, Julian’s tweets weren’t 3.3 times less impactful than Paul Jocelyn’s, but they were less impactful nonetheless.
Overall the differences in impact in Collaboration were relatively small compared to the rest of the Big 7.
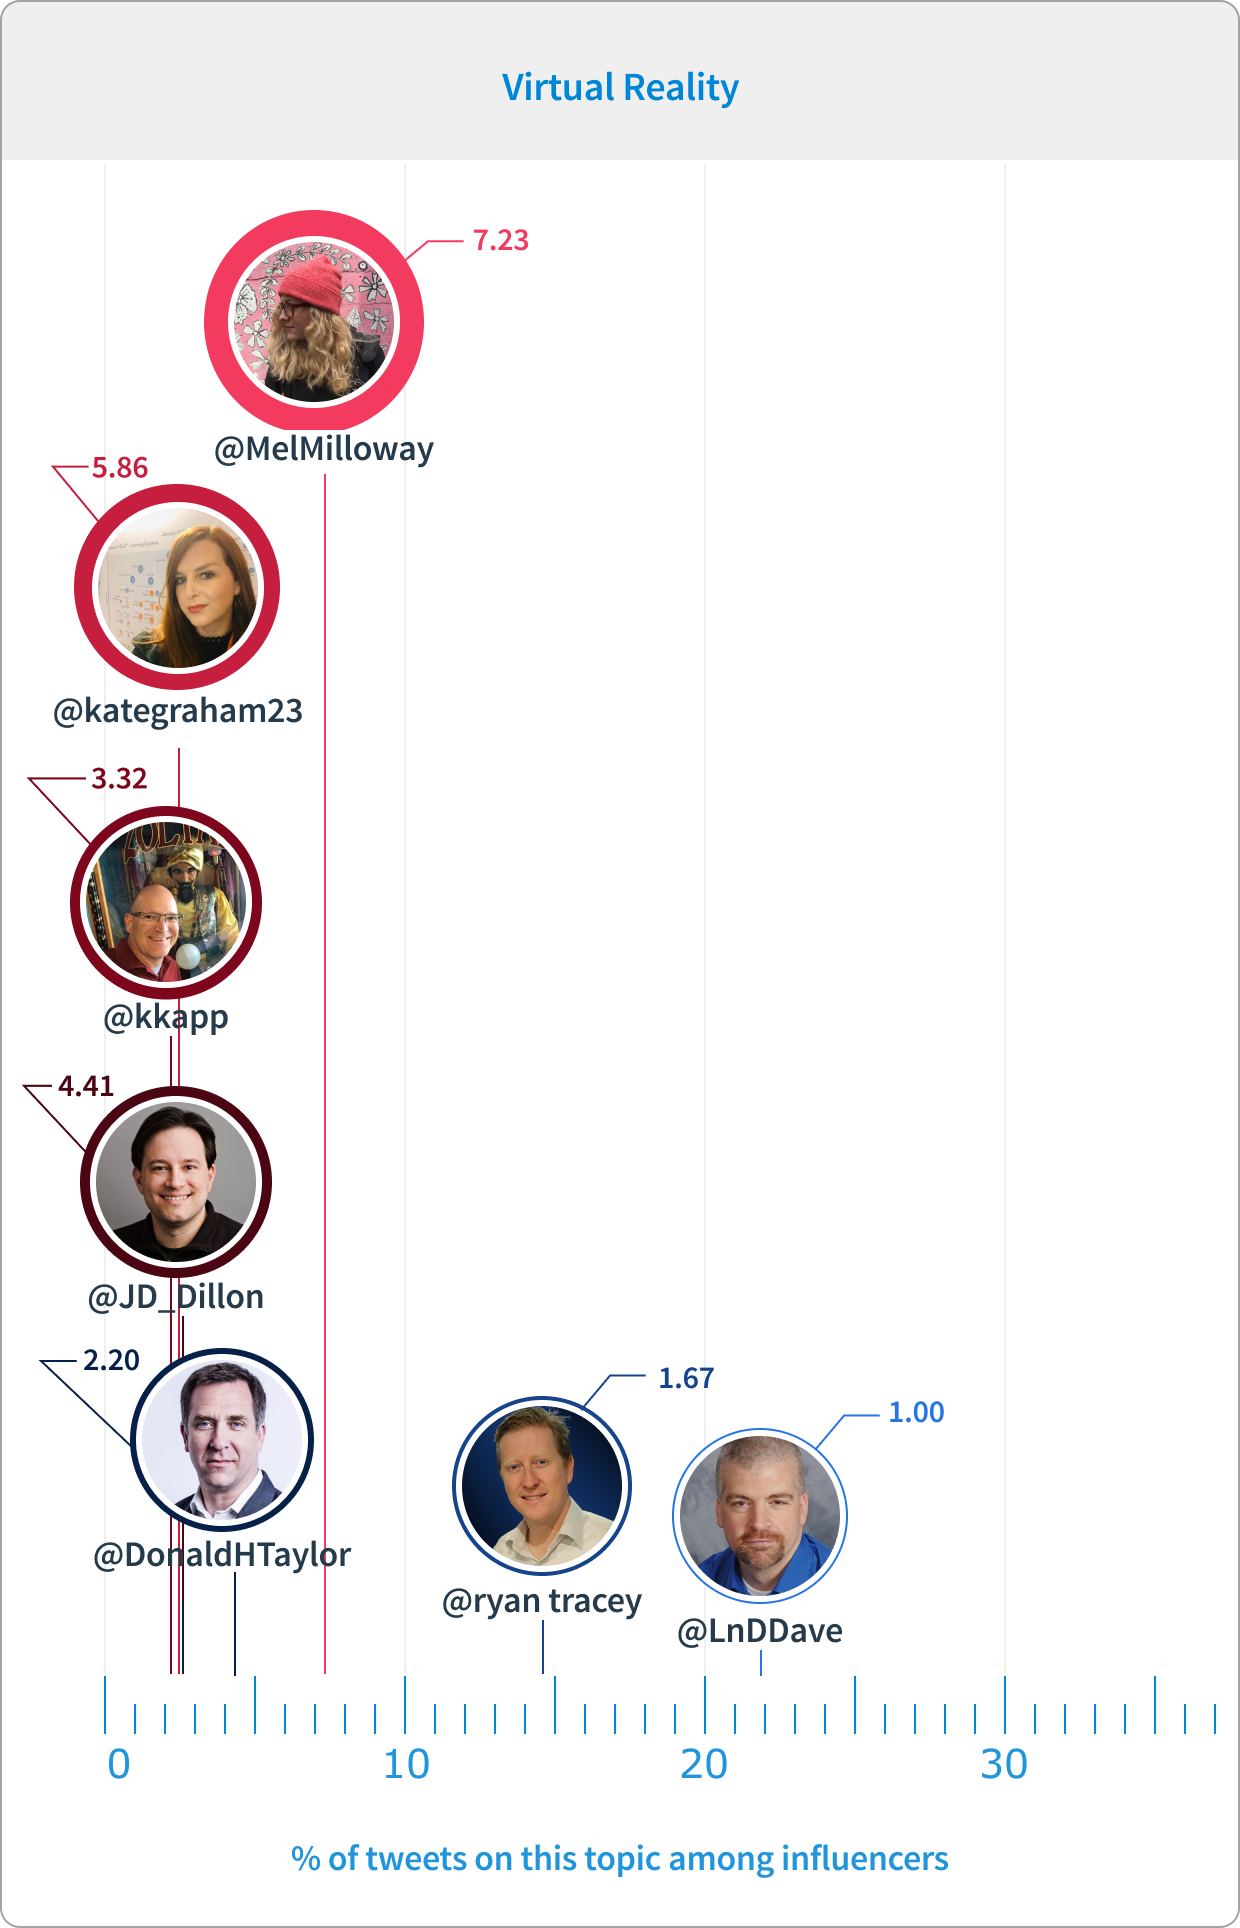
As mentioned, the Impact score considers many factors and is not a linear metric. It should always only be viewed in the context of a single topic.
Yet the higher the score, the higher the impact. We can see that in VR & AR, @MelMilloway had the highest Impact Score. Looking at the most frequent voices, @RyanTracey and @LnDDave also had a positive contribution to the VR sentiment.
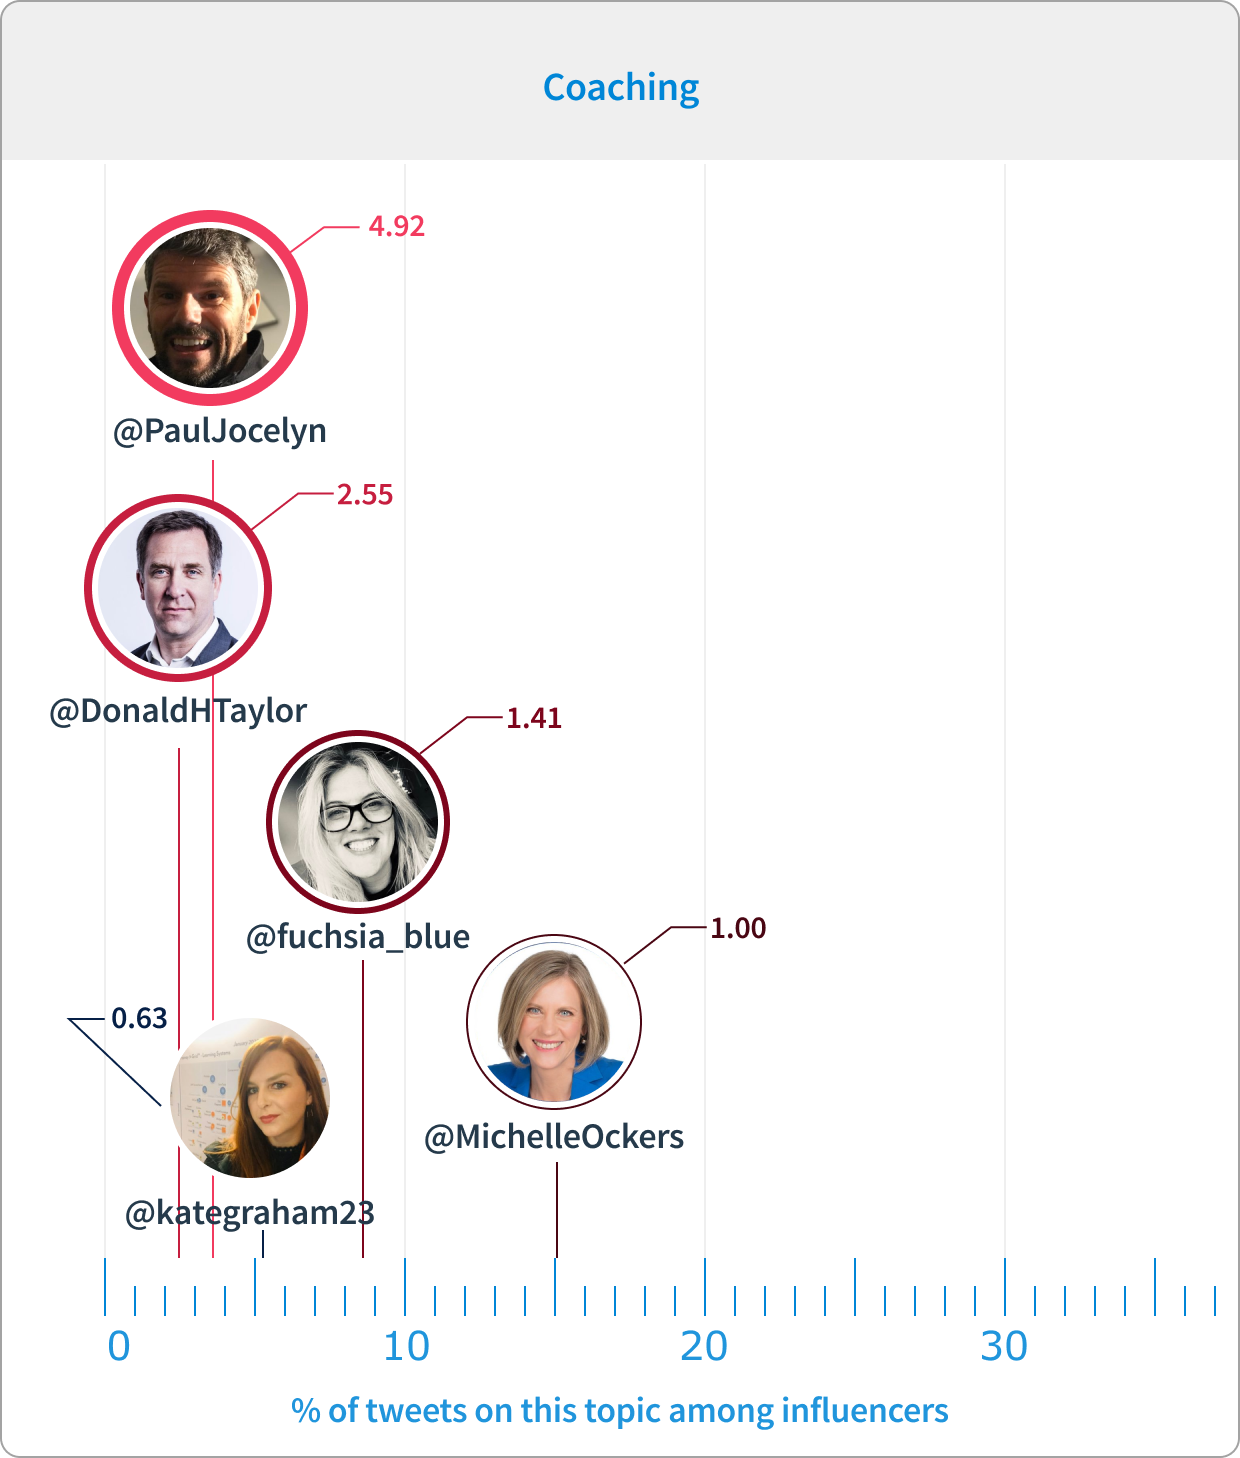
As in Collaboration, Paul Jocelyn seems to have captured the sweet spot. He tweets regularly enough about the topic for his tweets to have the highest Impact Score of the net contributors to Coaching. Closely following in 2nd place by impact is Donald Taylor, with Julie Drybrough coming third. Michelle Ockers, fourth in line by Impact Score, is the most avid of the influencers, having tweeted about Coaching as much as the top 3 most impactful combined.
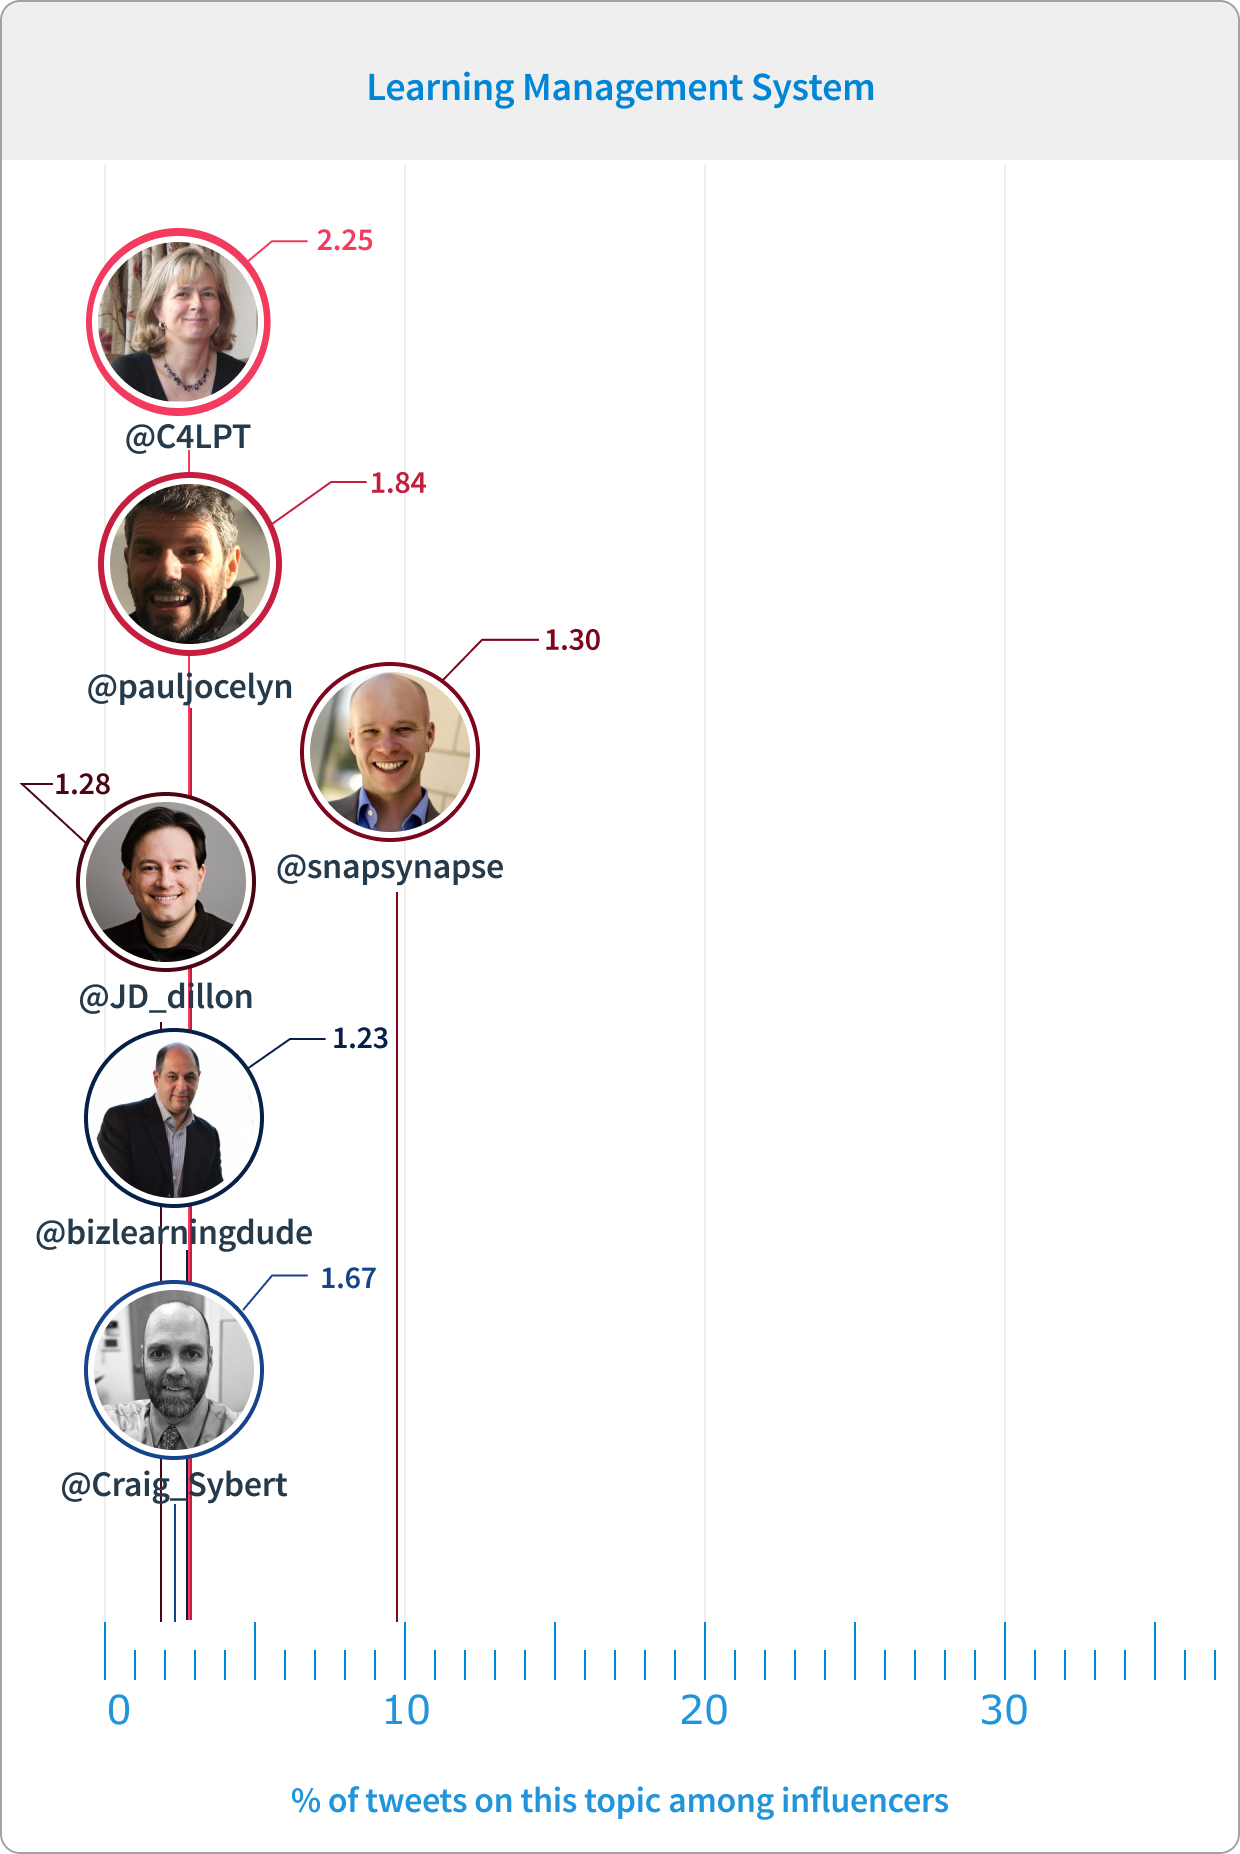
Tweets around learning management systems naturally have multiple champions, considering it’s a core part of most L&D professionals’ daily life.
Of those who placed with a net positive Impact Score on this list, Jane Hart has the most followers on Twitter, with an audience just shy of 34K. And although she doesn’t tweet a lot on the subject, her tweets on LMS have the highest impact in this tightly contested topic.
Sam Rogers AKA @snapsynapse, No. 3 by Impact Score, was the most avid net positive influencer in this topic with nearly 10 % of relevant tweets.
Let’s put this into some perspective. The person tweeting about LMS the most, and didn’t make our list of net positive influencers, had an Impact Score of just 0.07 (and it wasn’t Mr. Bond).
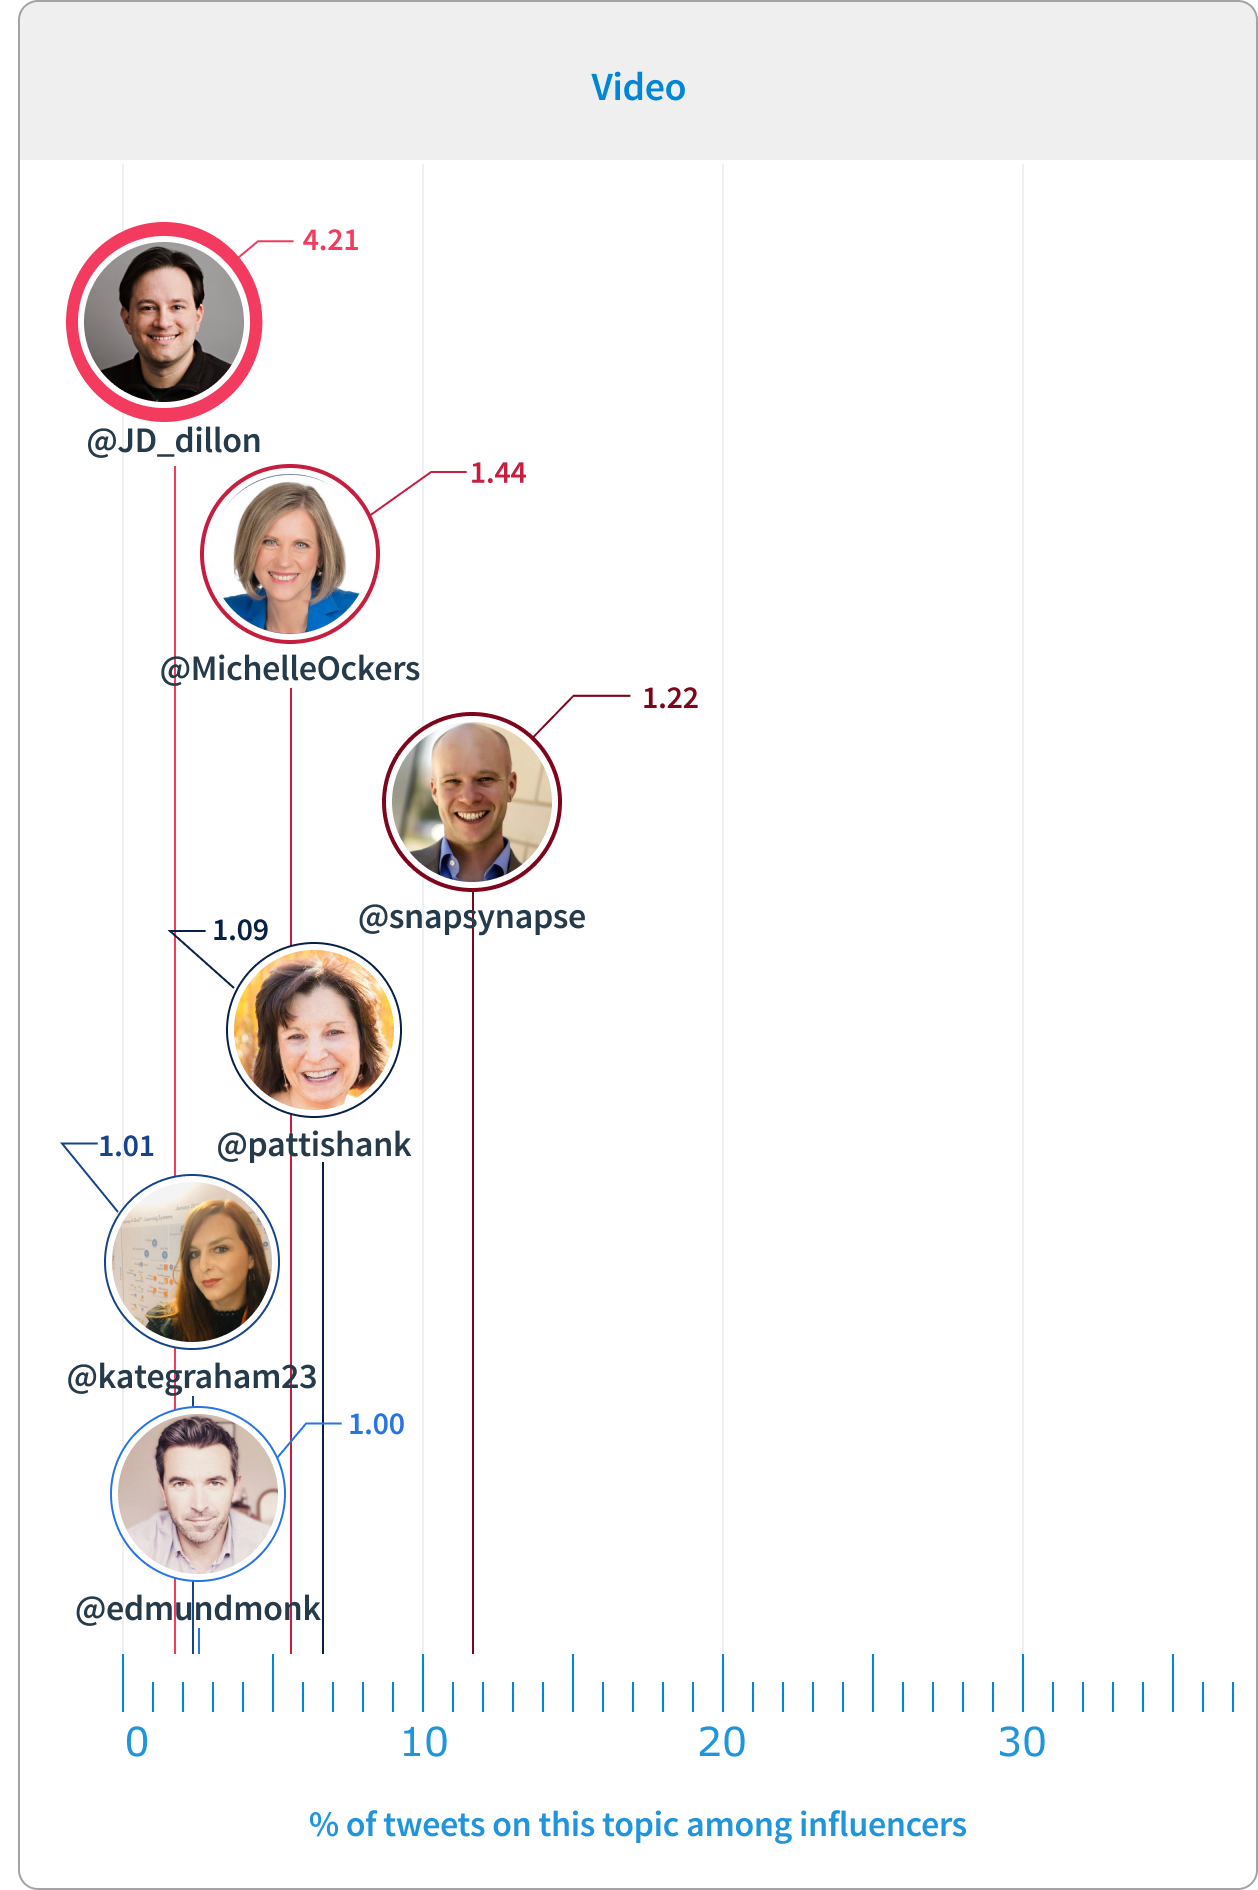
Video is a constant in L&D conversations. Interestingly, the impact landscape is very dense with little variation. The only standout is @JD_Dillon, coming in at No. 1. Whilst JD’s tweets had the biggest impact, there were also relatively few of those in the Video category. Sam Rogers (@snapsynapse) tweeted about video almost 6 times as much as JD, but still had one of the highest Impact Scores.
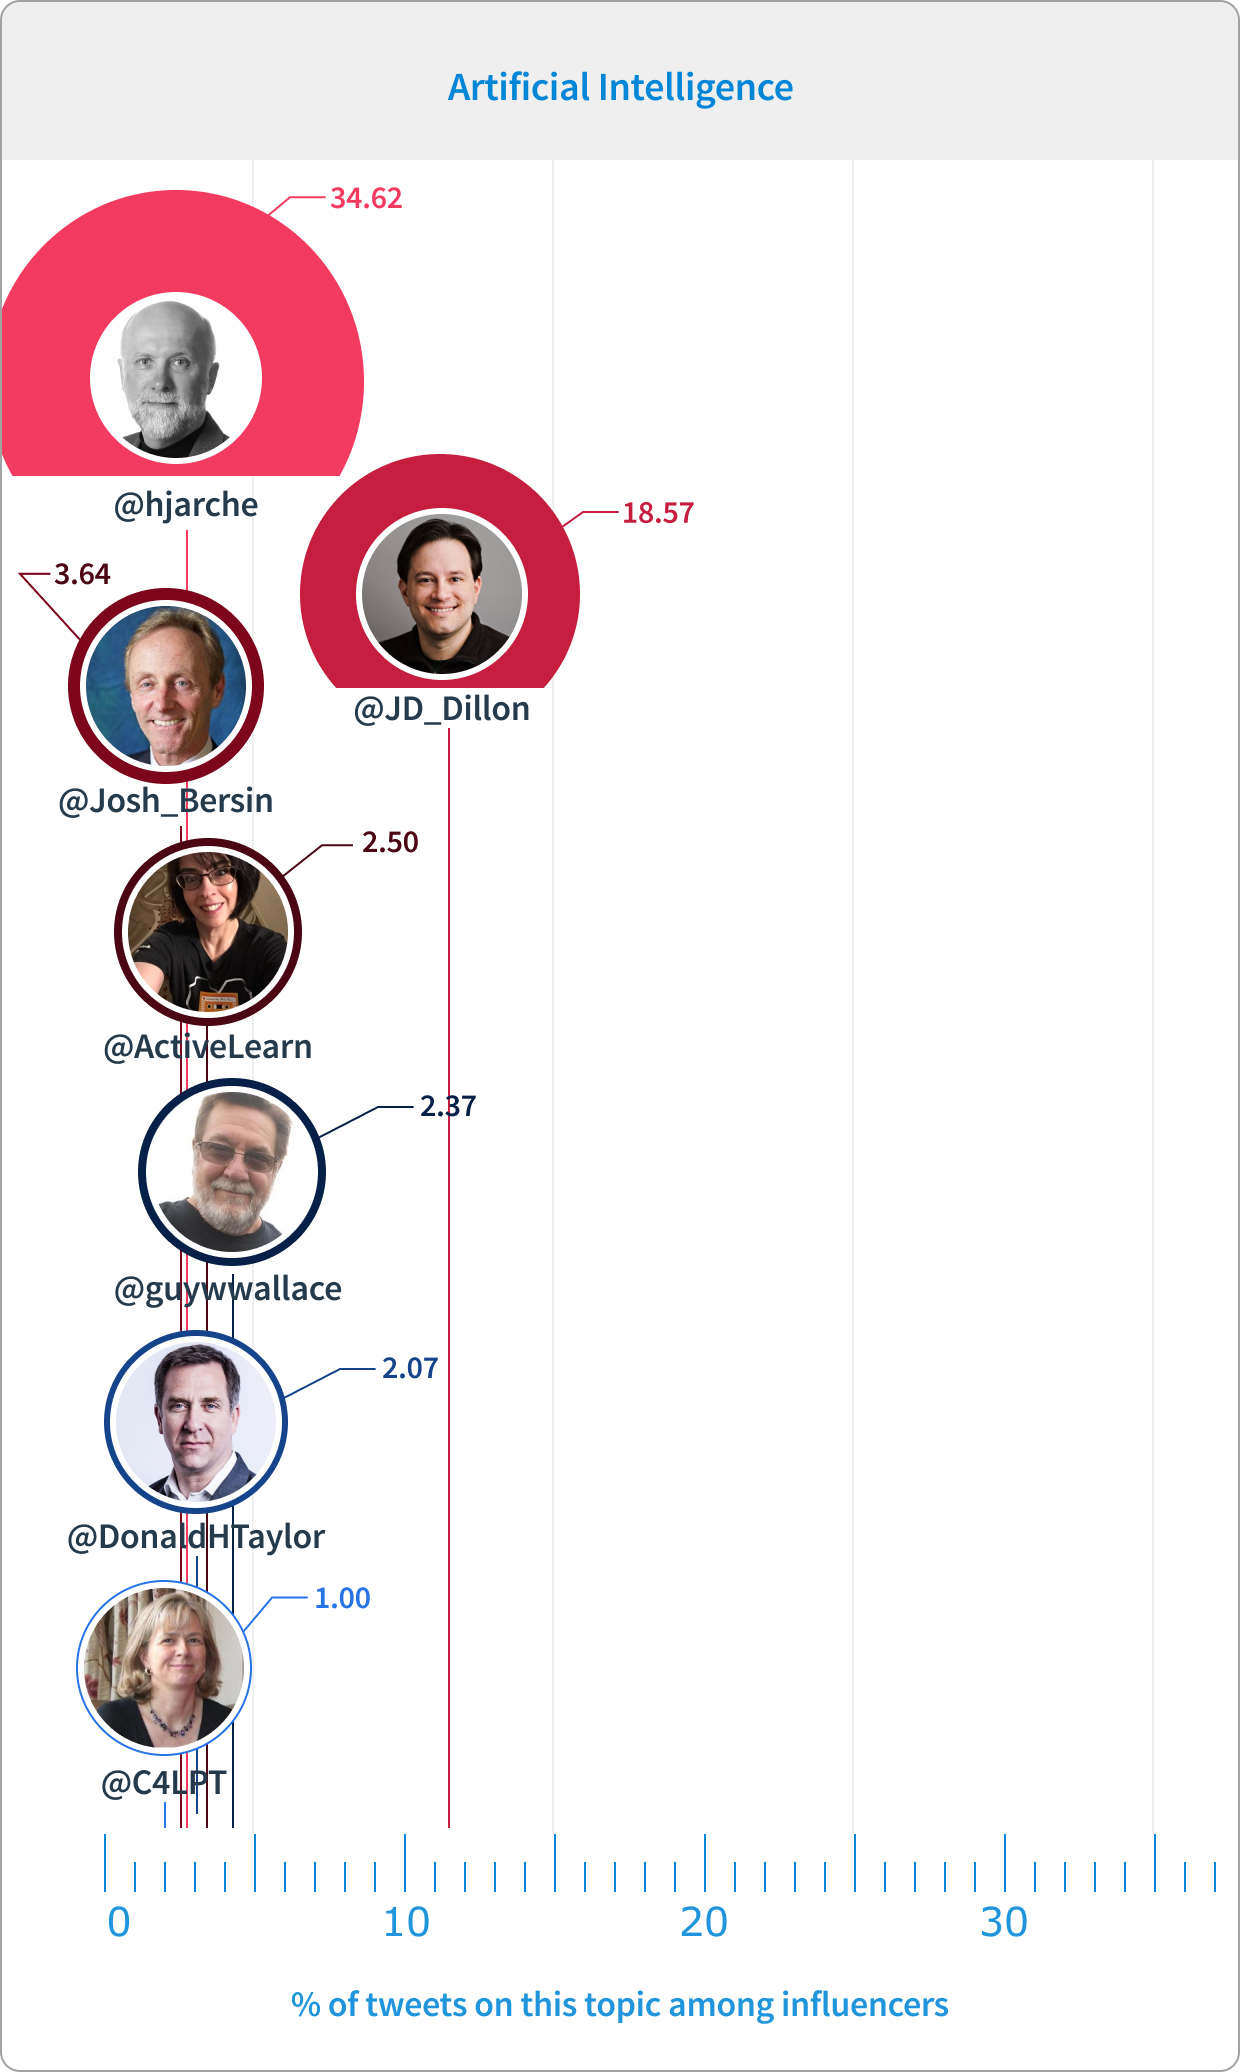
As the highest by far tweeted-about topic of 2019, AI has the largest variance in Impact Scores too. Harold Jarche (@hjarche), a 2019 addition to our list of influencers, made the biggest splashes with his tweets around AI. JD Dillon tweeted around AI far more (4.2 times more to be exact), yet still came in as solid 2nd in terms of Impact Score. Josh Bersin also made an appearance, rounding out the 3 most influential accounts on the most influential L&D topic of 2019.
Conversely, the second most-frequent tweeter on AI did not make this list. Not because we don’t like them – but because despite tweeting frequently, their tweets only had an Impact Score of 0.23. It goes to show that having a loud voice doesn’t always have a positive influence.
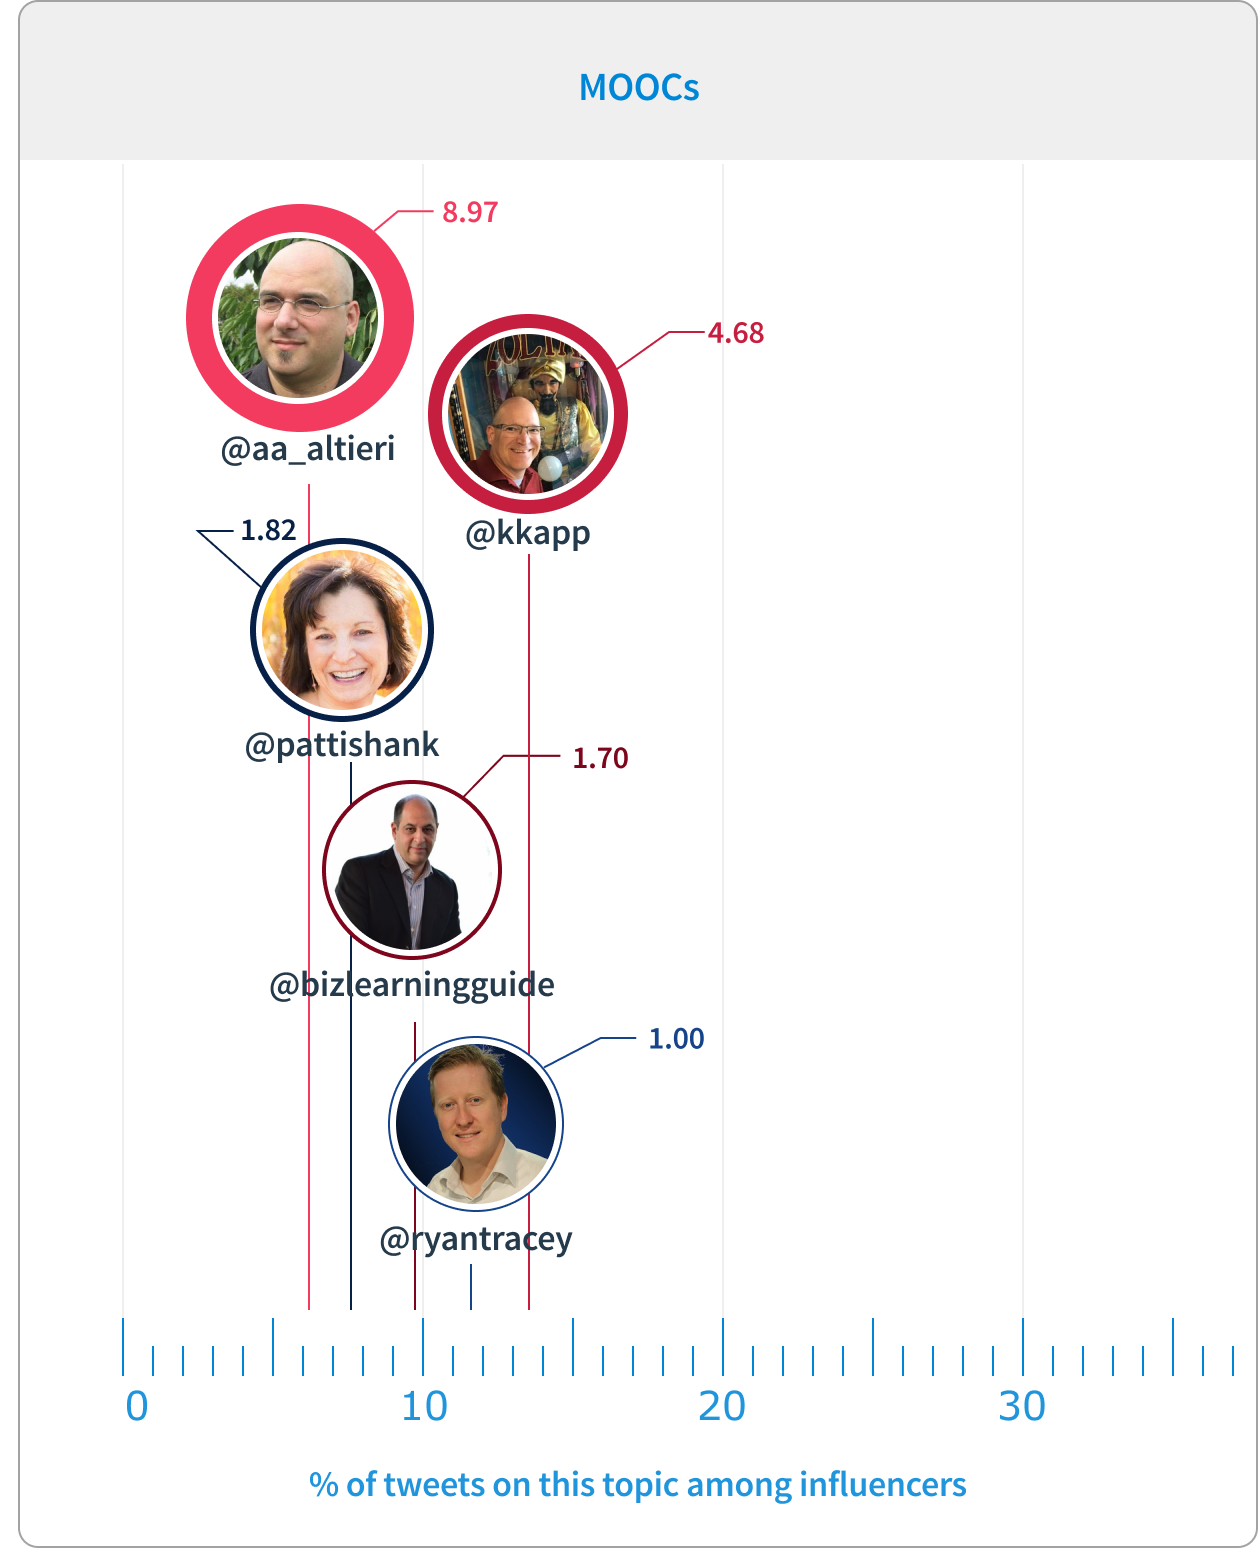
Disclaimer: MOOCs are at the bottom of the Big 7 topics that drove the L&D sentiment on Twitter in 2019, meaning this topic got mentioned the least. That being said, the top 5 influencers all tweet comparatively regularly on MOOCs.
Anthony Altieri’s tweets on this topic have been measured as the most impactful. Karl Kapp comes in second, with Patty Shank in 3rd. @kkapp is also the most avid tweeter of the top 5 measured by influence. Again for some comparison: the influencer who tweeted around this the most had an Impact Score of just 0.31.
Conclusion
Firstly, frequency doesn’t equal impact. In almost all of the Big 7, we found that a number of the most-frequent tweeters did not score highly on impact. If you think of your own Twitter feed, does this ring true for any influencers that you follow?
Secondly, we were delighted to observe a very different trend: 5 of the Big 7 topics had at least one individual in the top 3 both in frequency and also in their Impact Score.
The most thought about topics have clear champions, and those champions have a real, and positive impact on the L&D sentiment.
Finally, it is also clear from this is that it is easy to be impactful if you handpick what you say. When one talks about a topic a lot, creating original content naturally becomes much harder. As does providing a unique point of view.
Followers’ interest alignment to influencer
How well do our influencers know their audience?
True power on Twitter comes from trust and credibility – that’s how Influencers gain status. Having a good reach is also important. But, as seen in the previous chapter, life is so often a numbers game.To have an impact requires a careful balance of tweeting frequently and tweeting the right things to attract a well aligned audience.
Let’s revisit the Big 7 once more. This time, we will look at which influencers are most closely aligned to the topics their followers are also interested in.
We measure this through a Correlation Index, which is a figure between 0 and 100. The Correlation Index represents the alignment where 100 equals the best alignment (smallest divergence). This means the influencer and their followers are most closely aligned in regards to a displayed interest in a topic. On the other hand, a Correlation Index of 0 means the opposite, so no alignment of interest on a particular topic.
The Average Correlation Index is exactly what it says on the tin. When we filter the influencer list to those relevant enough to analyse, their correlation index is included in the average.
The higher the Average Correlation Index, the higher the alignment on the entire topic level.
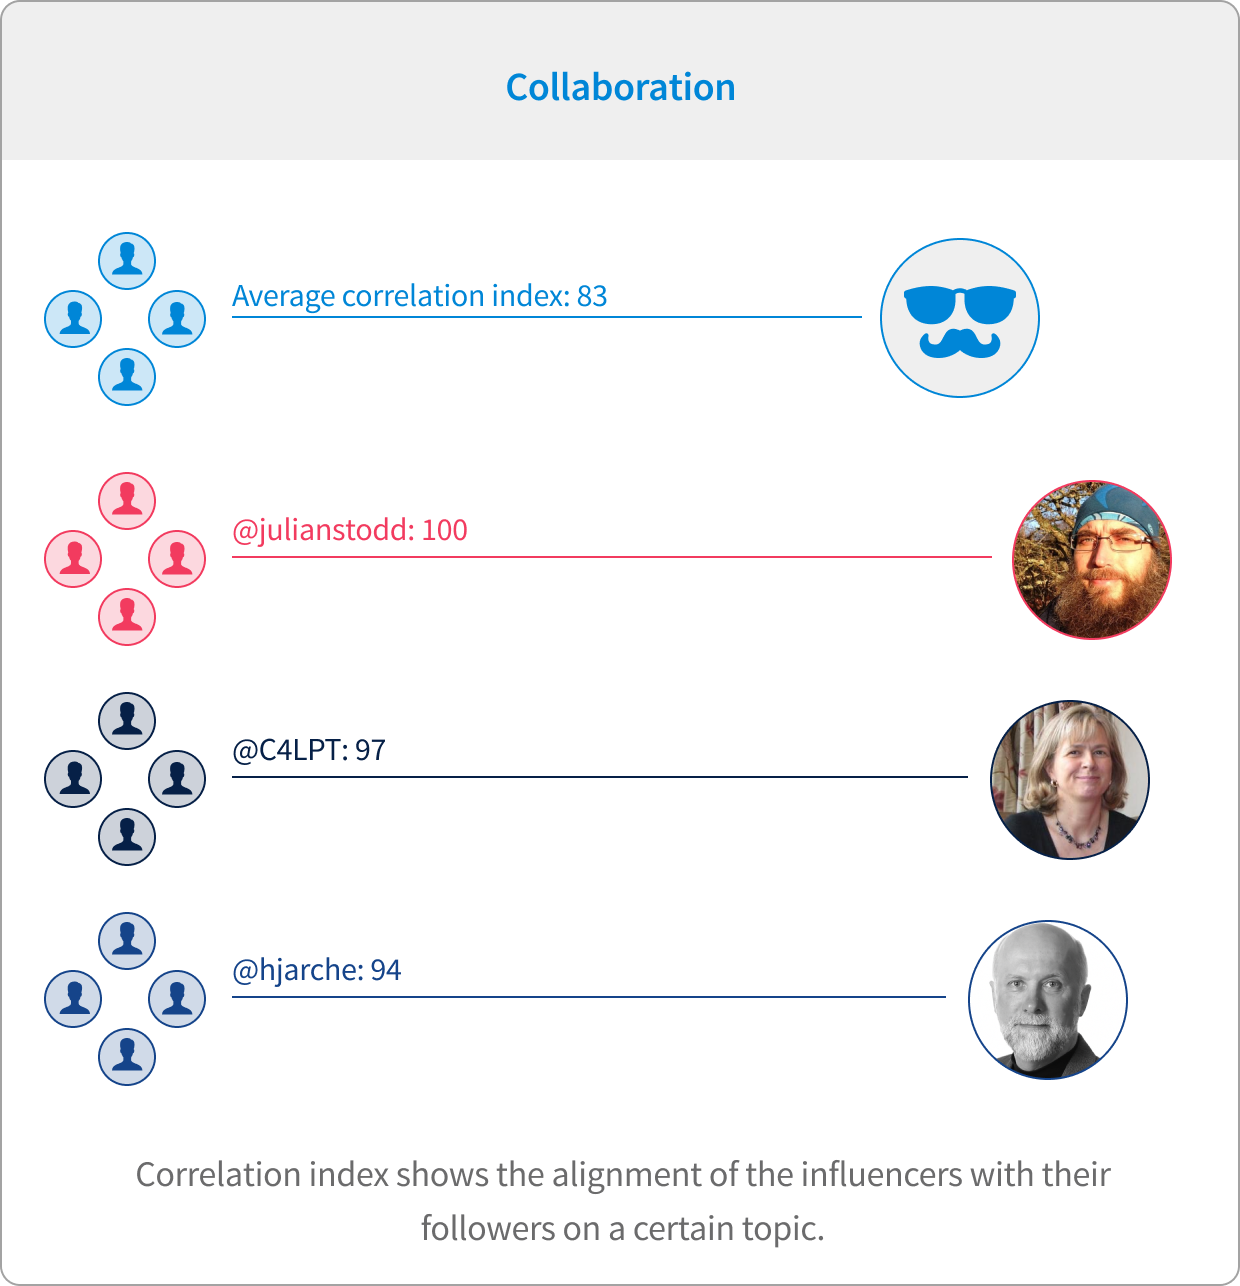
As we can observe, The Average Correlation Index for Collaboration was very high at 83, so to be top of this least was no mean feat. It’s also a topic that is widely talked about in L&D so it is something that is covered by lots of voices in the industry.
The winner: Julian Stodd (@julianstodd). Correlation Index: 100
The Sea Salt Learning captain was as closely aligned to his followers as anyone. Coming in first place amongst fellow influencers, Collaboration was the number 1 favorite L&D topic amongst his followers too.
Honourable mention: Jane Hart (@C4LPT). Correlation Index: 97
Jane Hart was very close behind Julian, as Collaboration was a topic of keen interest to her followers too.
Honourable mention: Harold Jarche (@hjarche). Correlation Index: 94
And just behind Jane we see Harold Jarche, who too was very much aligned in his interest on Collaboration with his followers.
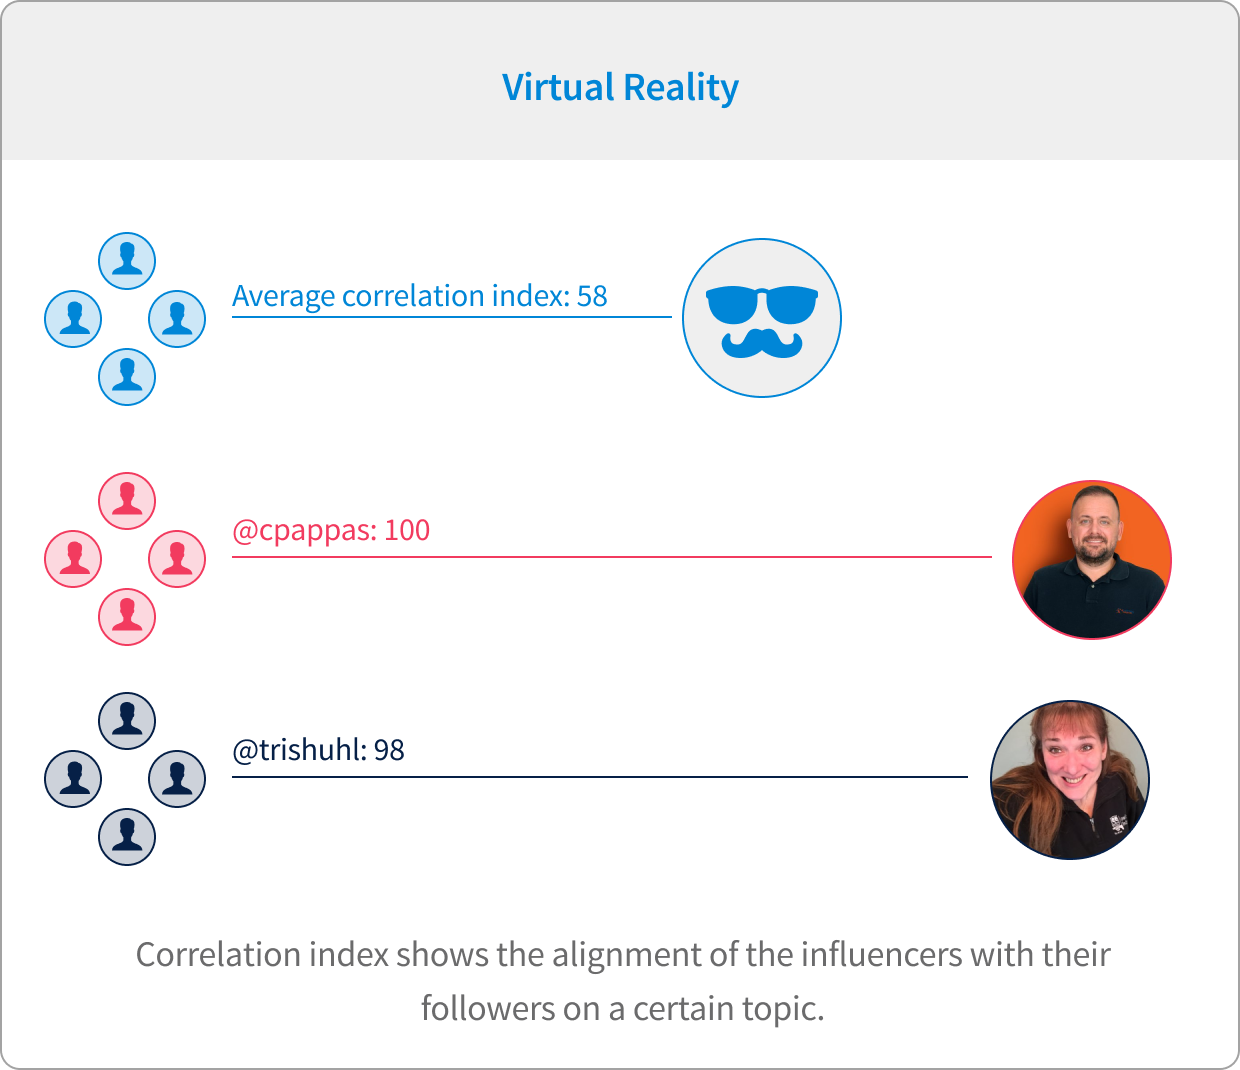
Of the Big 7, VR & AR had the biggest disparity when comparing how relevant the topic was to the influencer vs their followers. We also see that it had a modest Average Correlation Index of 58, showing that it’s not an easy topic to get right.
The winner: Christoper Pappas (@cpappas). Correlation Index: 100
Christoper Pappas however was well above the curve, showing a Correlation Index of 100. The highest of anyone in this category.
Honourable mention: Trish Url (@trishuhl). Correlation Index: 98
Anyone who knows Trish will know that she’s a passionate speaker on AI, so it seems slightly out of place to see her ranked so highly on VR. But here she (and her following) is.
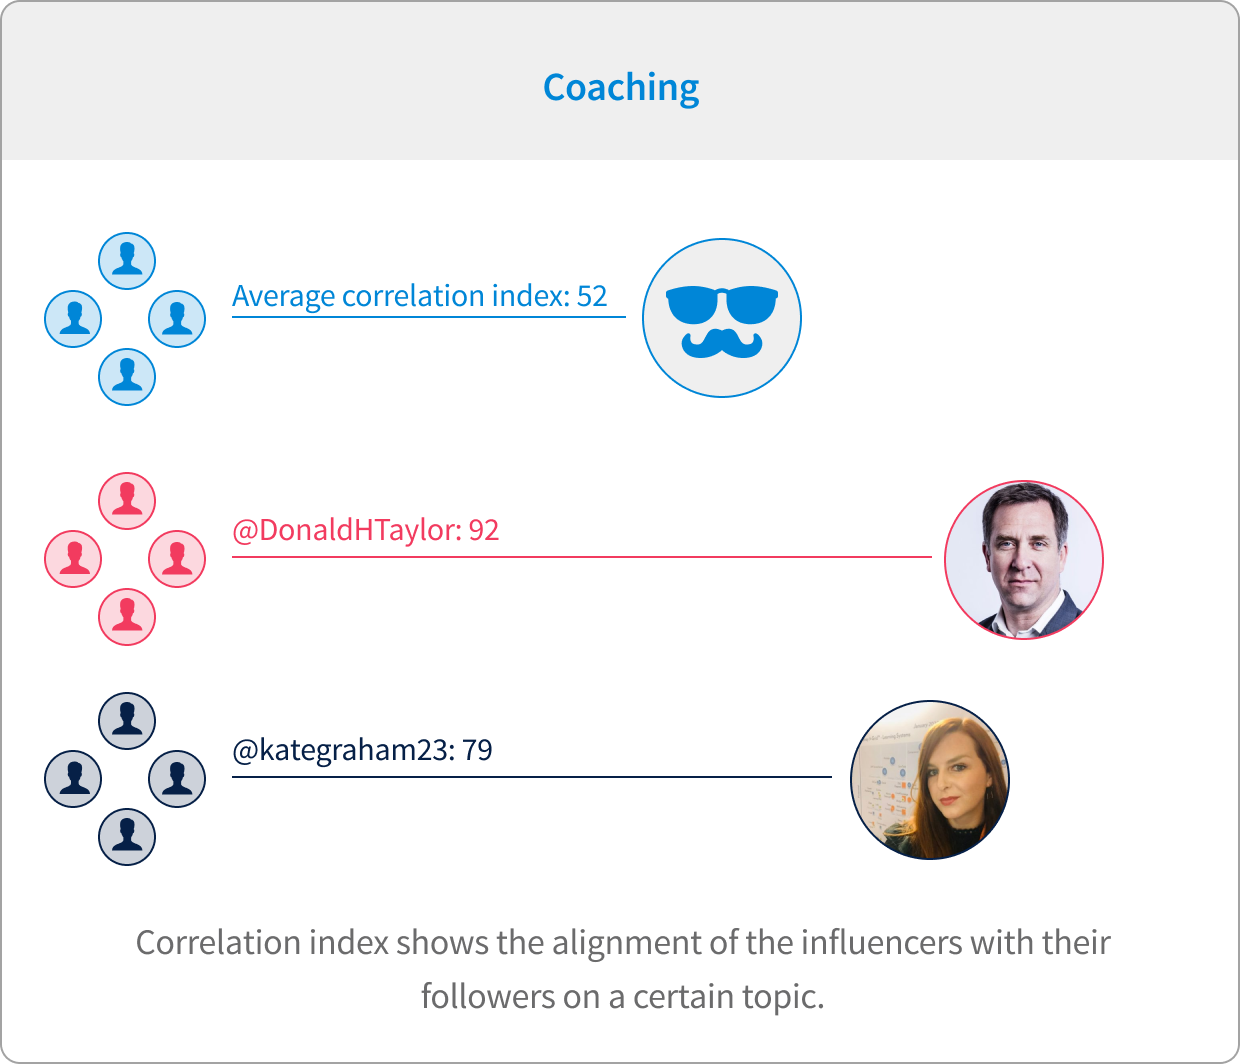
Coaching was massively driving the UK L&D sentiment, and lots of renowned voices were talking about the matter. As we can see however, it has a very modest Average Correlation Index of just 52. This is 13 points below the combined Big 7 average.
The winner: Donald H Taylor (@DonaldHTaylor). Correlation Index: 92
As Coaching was so important in the UK’s L&D sentiment, it is not surprising that it’s the UK influencers topping the charts on this one, with no other than the Chair of the LPI Don Taylor coming in at No 1.
Honourable mention: Kate Graham (@kategraham23). Correlation Index: 79
#womeninlearning are making headways on Twitter, and for all the right reasons. Kate has her finger on the pulse of the L&D community as much as anyone, so seeing her own interests around Coaching well aligned with that of her followers seems only natural.
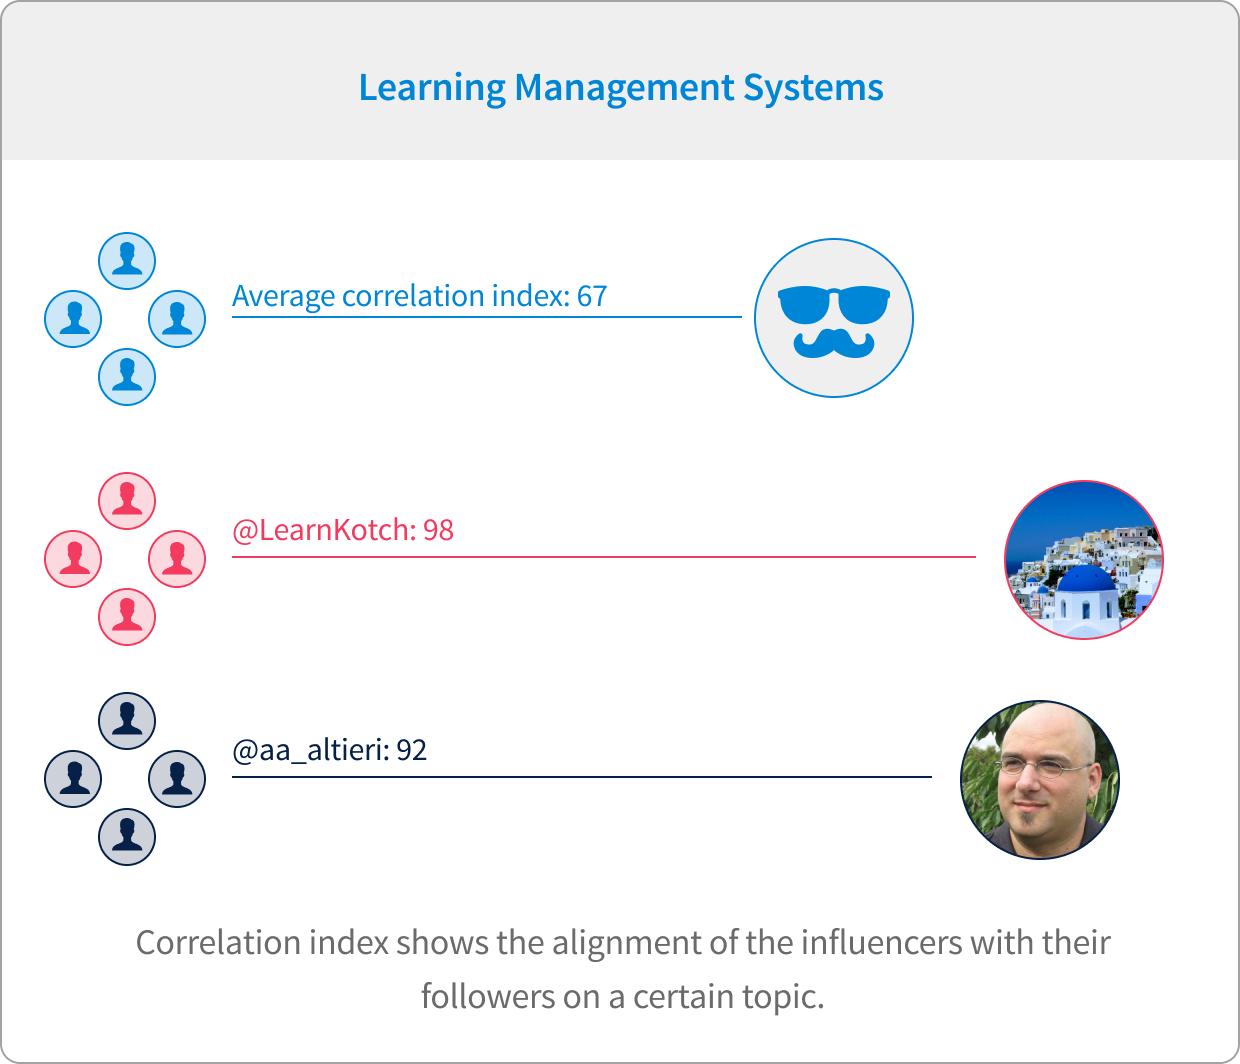
As with our impact charts, LMS had some fierce competition when it came to the top spot for correlation.
The winner: Con Sotidis (@LearnKotch). Correlation Index: 98
However a winner was quickly found. As founder and chief at The Learning Brokers, you’d expect Con Sotidis to know his stuff, and he clearly delivers. Con swept the competition to claim a Correlation Index of a whopping 98.
Honourable mention: Anthony Altiery (@aa_altieri). Correlation Index: 92
Anthony is an instructional developer, with a sincere and natural passion for elearning tech. That makes his placement on our honourable mentions list well within the norm here.
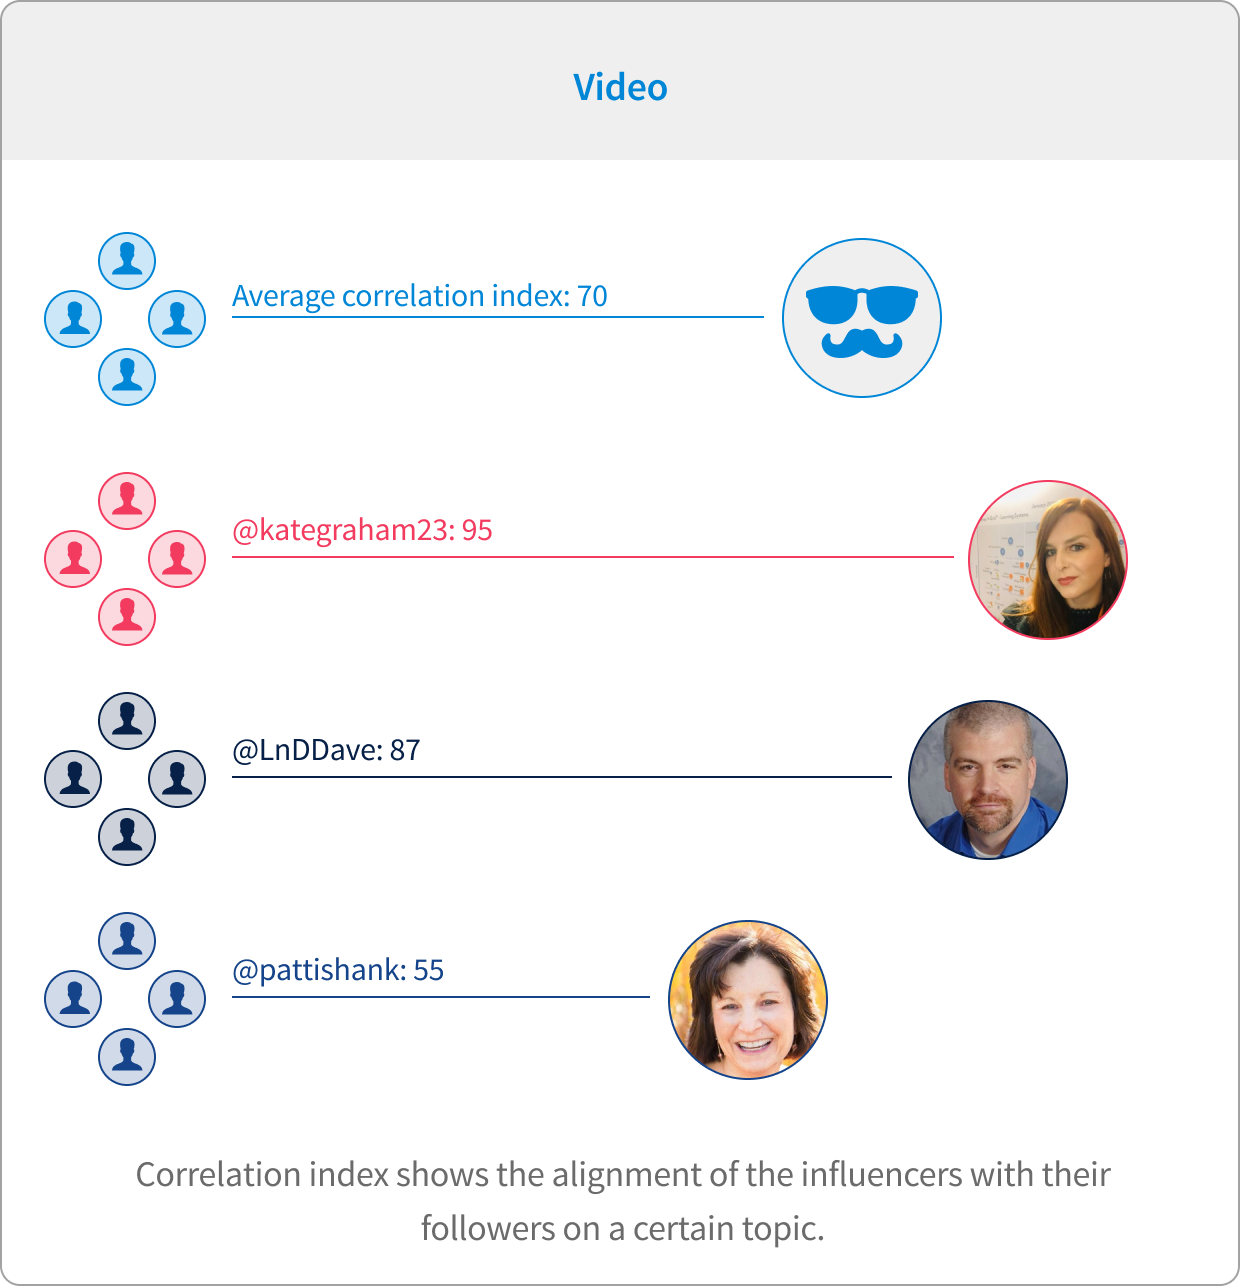
Video had a high Average Correlation Index of 70, so it would take an expert to be top of the list here, and that’s what we have with Kate.
The winner: Kate Graham (@kategraham23). Correlation Index: 95
Prolific on social media (dare we say it comes with the job?), it’s unsurprising that Kate seems to attract a following which is quite interested in this widespread media format.
Honourable mention: Dave Kelly (@LnDDave). Correlation Index: 87
Much like Kate, Dave is an avid Twitter user, so he was bound to be seen as a strong voice in at least one category.
Honourable mention: Patti Shank (@pattishank). Correlation Index: 55
Patti drove quite a lot of conversation and generated a significant impact in the topic overall. Still, we were slightly baffled to find that Patti’s interest in Video is not to be picked up as intensively amongst her following.
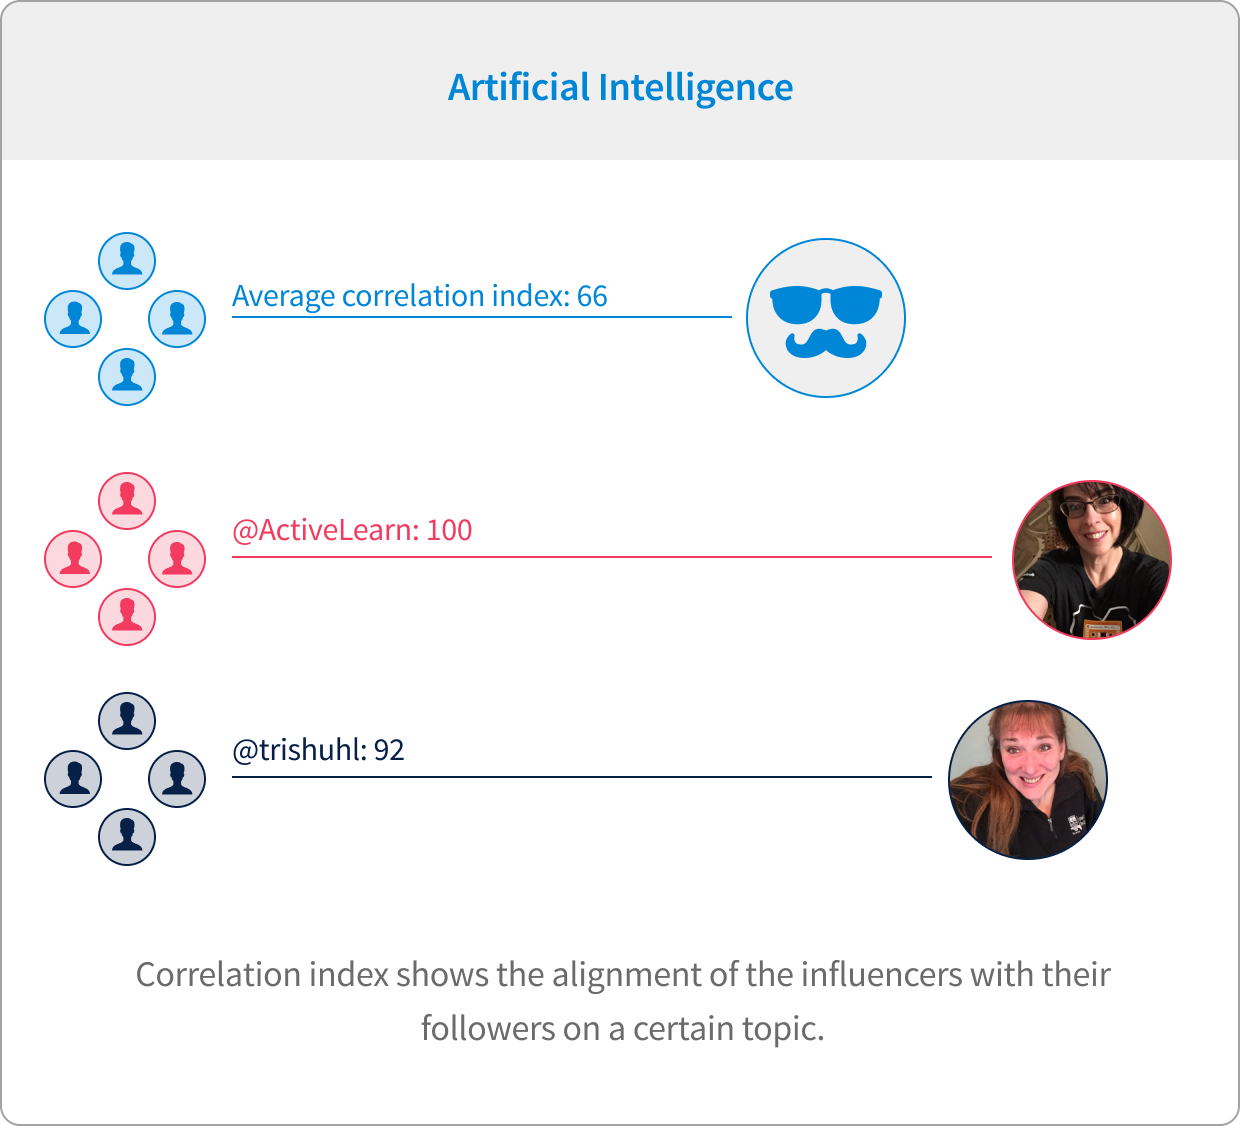
The clear winner of 2019, AI commanded a lot of attention that wasn’t contained to our lives as L&D people. Like AR and VR, there were also wild disparities between how relevant the topic was to the influencer vs their followers.
The winner: Helen Blunden (@ActivateLearn). Correlation Index: 100
AI was our most tweeted about subject this year, and had an above the mean Average Correlation Index of 66. By Helen Blunden taking the throne on the topic shows that she is a worthy AI opponent.
Honourable mention: Trish Uhl (@trishuhl). Correlation Index: 92
Trish does not look out of place on this list. She’s a frequent voice on AI in the L&D community, so was always going to be a high-placer on the topic.
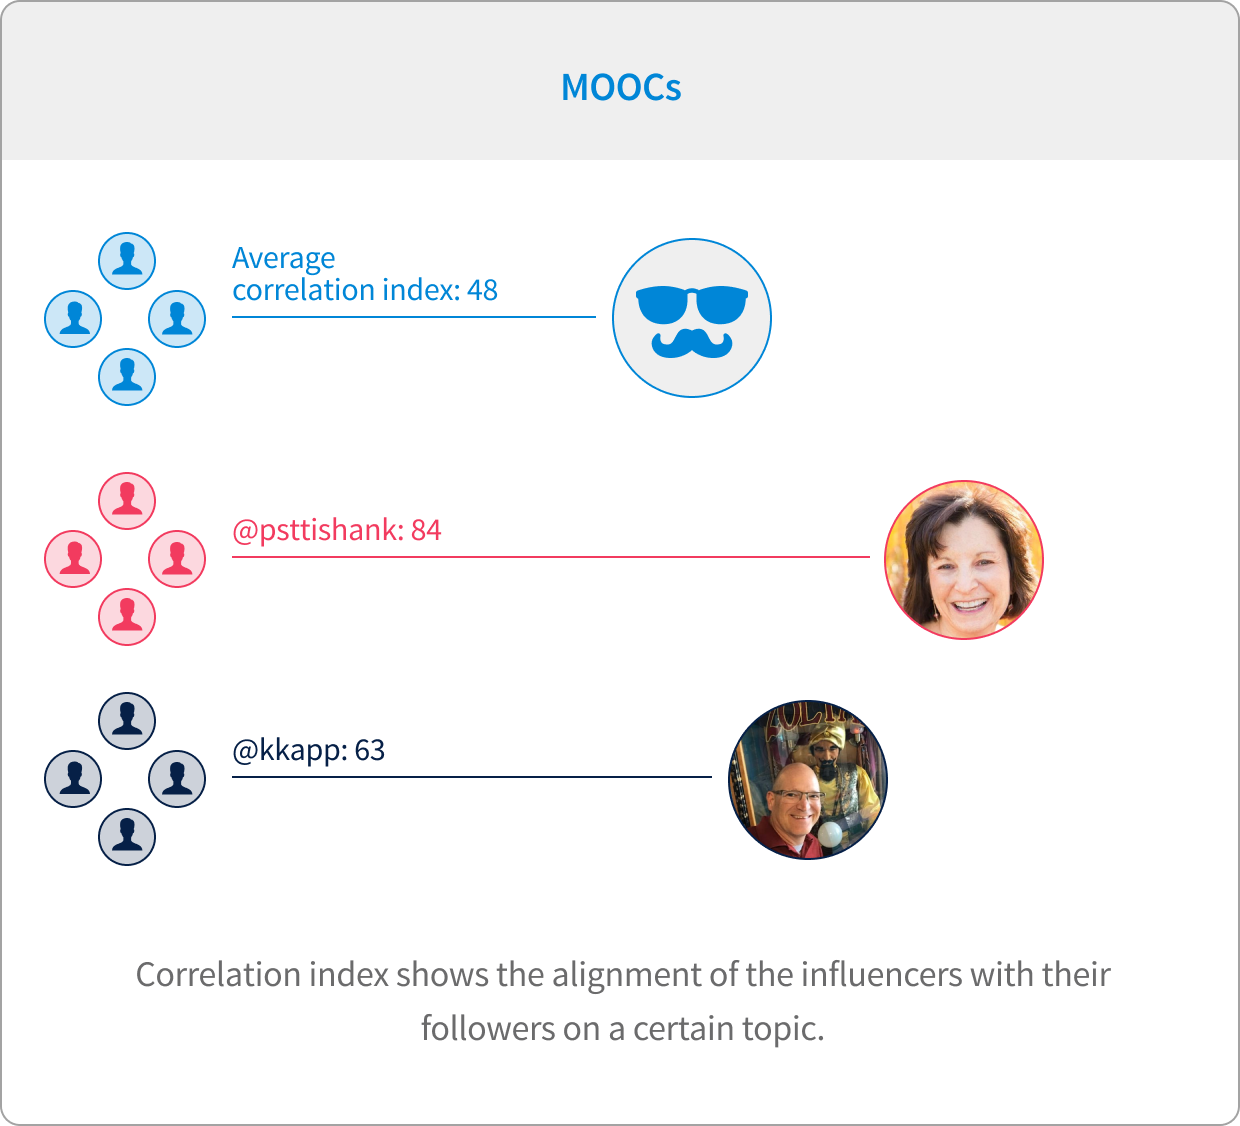
The frequency of people tweeting around MOOCs has been sliding on our charts steadily since 2016. MOOCs also have the lowest Average Correlation Index of 48, 17 percentage points below the Big 7 average.
The winner: Patti Shank (@pattishank). Correlation Index: 84
That being said, Patti remains the go-to influencer for her audience on the subject of MOOCs. Having a well-above-average Correlation Index of 84, Patti has her finger on the MOOC pulse better than anyone else on Twitter at the moment.
Honourable mention: Karl Kapp (@karlkapp). Correlation Index: 63
A first-entry on the list for Karl this year. Following closely behind @pattishank, Karl is the second most enthusiastic on Twitter for delivering a 240-character insight into MOOCs
Conclusion
It’s great to see that so many influencers are so closely aligned with the interests of their followers. Especially in the larger topics, like Coaching, competition is fierce.
What is clear is that Twitter users can clearly depend on multiple voices in certain topics. And our influencers are strong voices throughout L&D, not just in one subject.
Final thoughts
Hopefully, this piece of research has given you a thorough insight into what L&D is actually talking about. As with all research, we stumbled across a few surprises. There is the ever clearer shift towards AI, and, much more interestingly, Coaching. Then comes the decline of once popular topics like gamification or personalisation.
Finally, our biggest surprise was just how well – or should we say poorly – connected L&D actually is on Twitter.
If you’d like to know more about our research, or want to ask the team any questions about this report, then please get in touch by emailing hello@jollydeck.com, or drop us a message on Twitter.
Related articles
 Initial results of our survey we run for the 4th year in a row.
 User engagement in e-learning is a huge problem, and there are generally two approaches to deal with it: the Dogmatic and the Heretical Approach.
 The Internet is full of stock photos, and it’s never been easier finding a good-looking image that goes well with the topic of your learning content.