


It’s no big news to say that we go around doing a lot of presentations of JollyDeck as a communication and learning tool, right? Well, it’s true. We do it. A lot. Every day. Mornings, mid-day, evenings. You get the picture. During informal as well as formal and even over the beers talks it gets down to spilling out the numbers (the data) that illustrate our story. Which also makes it credible and not simply the product of our over-imaginative minds.
Saying that JollyDeck trainings result in deep engagement, high retention and fantastic user satisfaction is one thing, but backing those up with numbers, surely brings conversations to another level.
Our analytics run deep…
In the process of planning training campaigns with our clients we spend time discussing the importance of setting up a good (data) foundation to get quality analytics after the training has ended. Playing with data is fun, especially with detailed data which can provide many in-depth clues.
However, sometimes you just want to see the big picture and really not go that deep down. How do we perform on a company level – can we assume we are a really engaged bunch all moving towards the same goal (something that every manager dreams of). Or could we do with some more alignment and focus?
These questions are somewhat classical management considerations and running a JollyDeck learning campaign will not give you feedback regarding your employee engagement in general (it might provide a first hint of what it could be for your company, though!). Launching a learning campaign with us will give you insight into many metrics upon which you can assess the success of your training. And now, let’s dive into the main three shall we?
All the data that is presented below is based on the selection of 29 campaigns that we’ve done with 14 different clients during 2014.
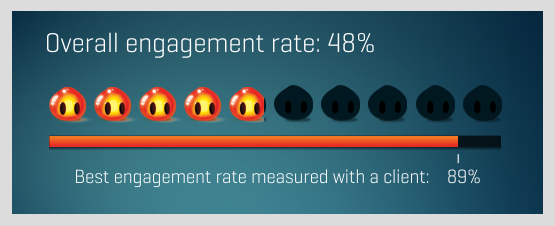
Engagement rate
Engagement rate will uncover what percentage of your population has been actively involved with the learning campaign.
From the sample 29 non-compulsory campaigns almost 11.000 invitations were sent out to participants and more than 5.000 accepted our invitation, created their avatar and finished at least one (but on average many more) learning game.
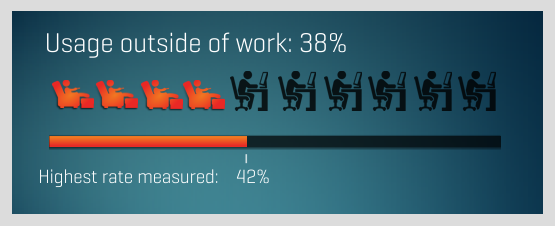
Usage outside of work
Usage outside of working hours is one of the KPIs that could be interpreted as the second side of the “engagement rate” coin. Engaged employees will show more passion and attitude towards the goals they are working for at their daily job and are thus more likely to prolong that attitude into the time they are not spending in the office, right? In the majority of cases we’d say it’s safe to predict that. But – let the numbers do the talking…
From our sample of campaigns, here’s how the usage was split:
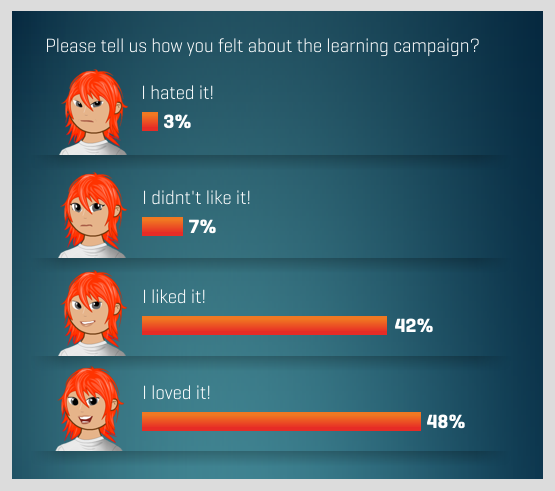
Employee satisfaction
Based on the two indicators we described it would be easy to draw conclusions of the employee satisfaction with the learning campaign. They are engaged, they spend their free time using it, it doesn’t take much to add the numbers together, right?
Assuming is one thing, collecting the data is another, and that’s why we do feedback collection at the end of campaigns. For us this is the most exciting moment in a campaign – no matter how well the KPIs look, there’s always the expectation of players say!
This is the aggregate feedback received on all 29 sample campaigns:
There are other indicators upon which we measure success of JollyDeck training campaigns and we will dive into those in our later posts, however these three are our “golden” ones.
After all – comparing different training methods delivered within the same environment (company) can be a un-thankful task. We do know, though that in any employee-related activity companies will focus on at least two measures of success: how many employees have taken part in it (=engagement) and general satisfaction and perceived usefulness of it. There are not many learning efforts that result in voluntary employee engagement after they are done with their daily job and that’s why we introduced “usage outside working hours”. It is a metric that illustrates the power of our tool and the extra value it brings to our clients. There are not many learning solutions that promise to do the same (or deliver at the end of the day!).

TheCMonster, Santander
Would like to say that the game was very enjoyable and hopefully more games like this to come in the future!

Tas, British Gas
What a fun easy way to learn. I loved it and felt I learnt a lot with no pressure. Thank you

SDavidson93, Simply Business
Really good idea and great way of getting peoples brains working and updating their knowledge.

p8nt, Telefonica
i love it! it was great, i learned a lot more than i knew already, it was really engaging and addicitve

Maya, Thomson Reuters
Hi – as a new employee I found it very usefull and suggest that you adapt this as a learning tool going forward as it ensures you grasp the concept due to repetition.