What learning analytics are available when publishing content in JollyDeck Create?
Learning analytics help you understand how your learning content is used. Depending on how you publish your course in JollyDeck Create, you can access different types of usage data.
In general, JollyDeck Create provides essential insights that help you monitor learner activity and track how your content is accessed. The available analytics depend on the publishing method you choose.
Analytics when inviting users individually
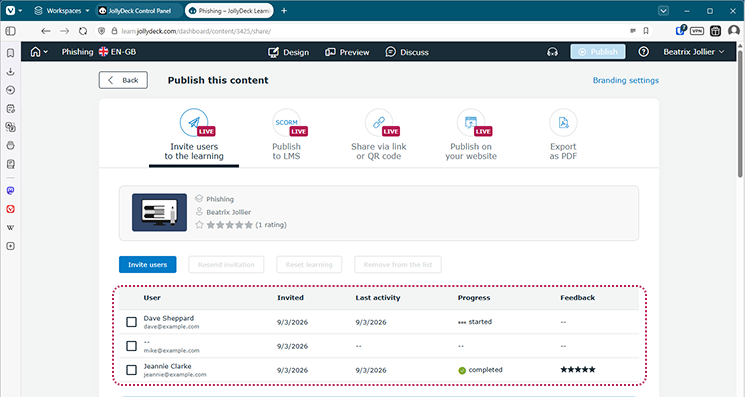
Inviting users directly to a course is the most common way to publish content from JollyDeck Create. This option allows you to track the activity of each learner individually.
At the bottom of the publishing page, you’ll find a list of all invited users together with several learning analytics:
- date of the invitation
- date of the learner’s last activity in the course
- learner’s progress in the course (not started, in progress, completed)
- feedback comments from the learner
This information helps you quickly see who has started the course, who has completed it, and who may still need a reminder.
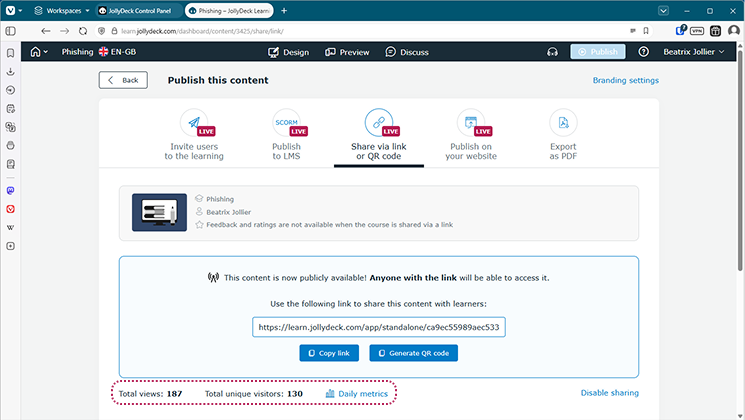
Sharing a course link or embedding the course
If you do not want to invite learners individually, you can publish your course by sharing a direct link or by embedding it on your website. For example, you can send the link by email, share it on social media, or provide access through a QR code.
When the course is accessed this way, JollyDeck Create does not track individual learners. Instead, it provides aggregated usage metrics that help you understand how often the content is accessed.
At the bottom of the publishing page, you can see three metrics:
- total number of visits
- number of unique visitors
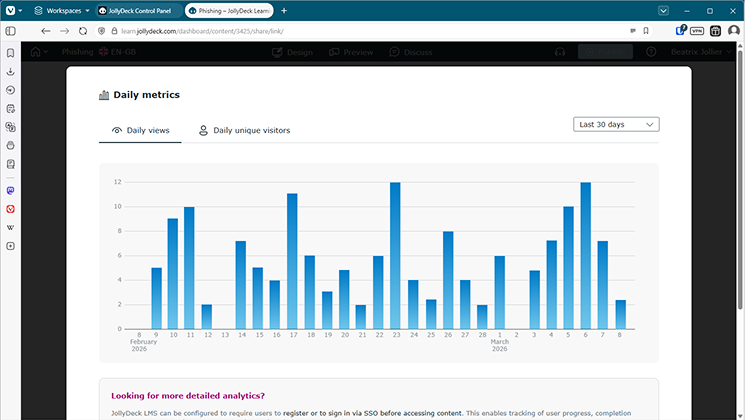
- daily metrics
Daily metrics provide a breakdown of visits and unique visitors by day and show how these numbers change over time. The data is displayed as a bar chart with the number of views or unique visitors for each day.
These analytics provide a quick overview of how widely your content is being accessed and how engagement changes over time.
Exporting SCORM for use in an external LMS
You can also export your course as a SCORM package and publish it in your own learning management system.
In this case, learner activity is usually tracked by your LMS rather than by JollyDeck Create. The type and level of analytics therefore depend on the capabilities of the LMS you are using.
However, if you export the course using the Live SCORM format, JollyDeck Create can still provide basic usage data similar to what you get when publishing through a link or embedding the course on a website.
This can be useful if your LMS does not provide these metrics, or if you want an additional way to verify the usage data.
What JollyDeck Create analytics are best suited for
JollyDeck Create analytics give you a clear overview of how your course is being used.
They help you quickly:
- see who has started or completed the course
- identify learners who have stopped or become inactive
- send reminders to learners who have not finished the course
- understand how widely your course is being accessed
- monitor how engagement changes over time
This makes it easy to track participation and course reach without needing to publish your content through a full learning management system.
Need more advanced analytics?
If you need deeper insights into how learners interact with your content, you may want to explore JollyDeck LMS.
The LMS includes a dedicated analytics module that allows you to track learner progress in more detail, identify knowledge gaps, and analyse how your learning content performs over time.
If you would like to see what is possible, contact us to schedule a demo of JollyDeck LMS.
Related resources: